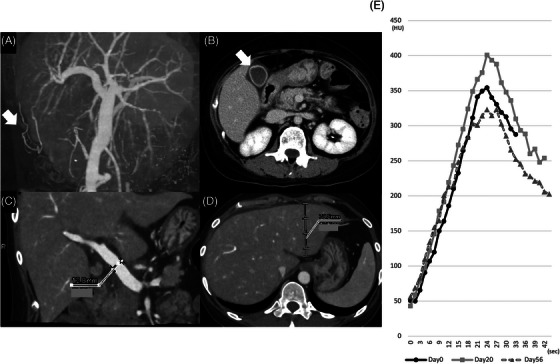
FIGURE 1.

(A) Paraumbilical vein (arrow). (B) Gallbladder wall thickening (arrow). (C) Increased portal vein (PV) diameter (12.8 mm). (D) Hepatomegaly (left lobe vertical diameter, 70.8 mm). (E) The value of the contrast effect at the portal vein scan every 1.5 s.
