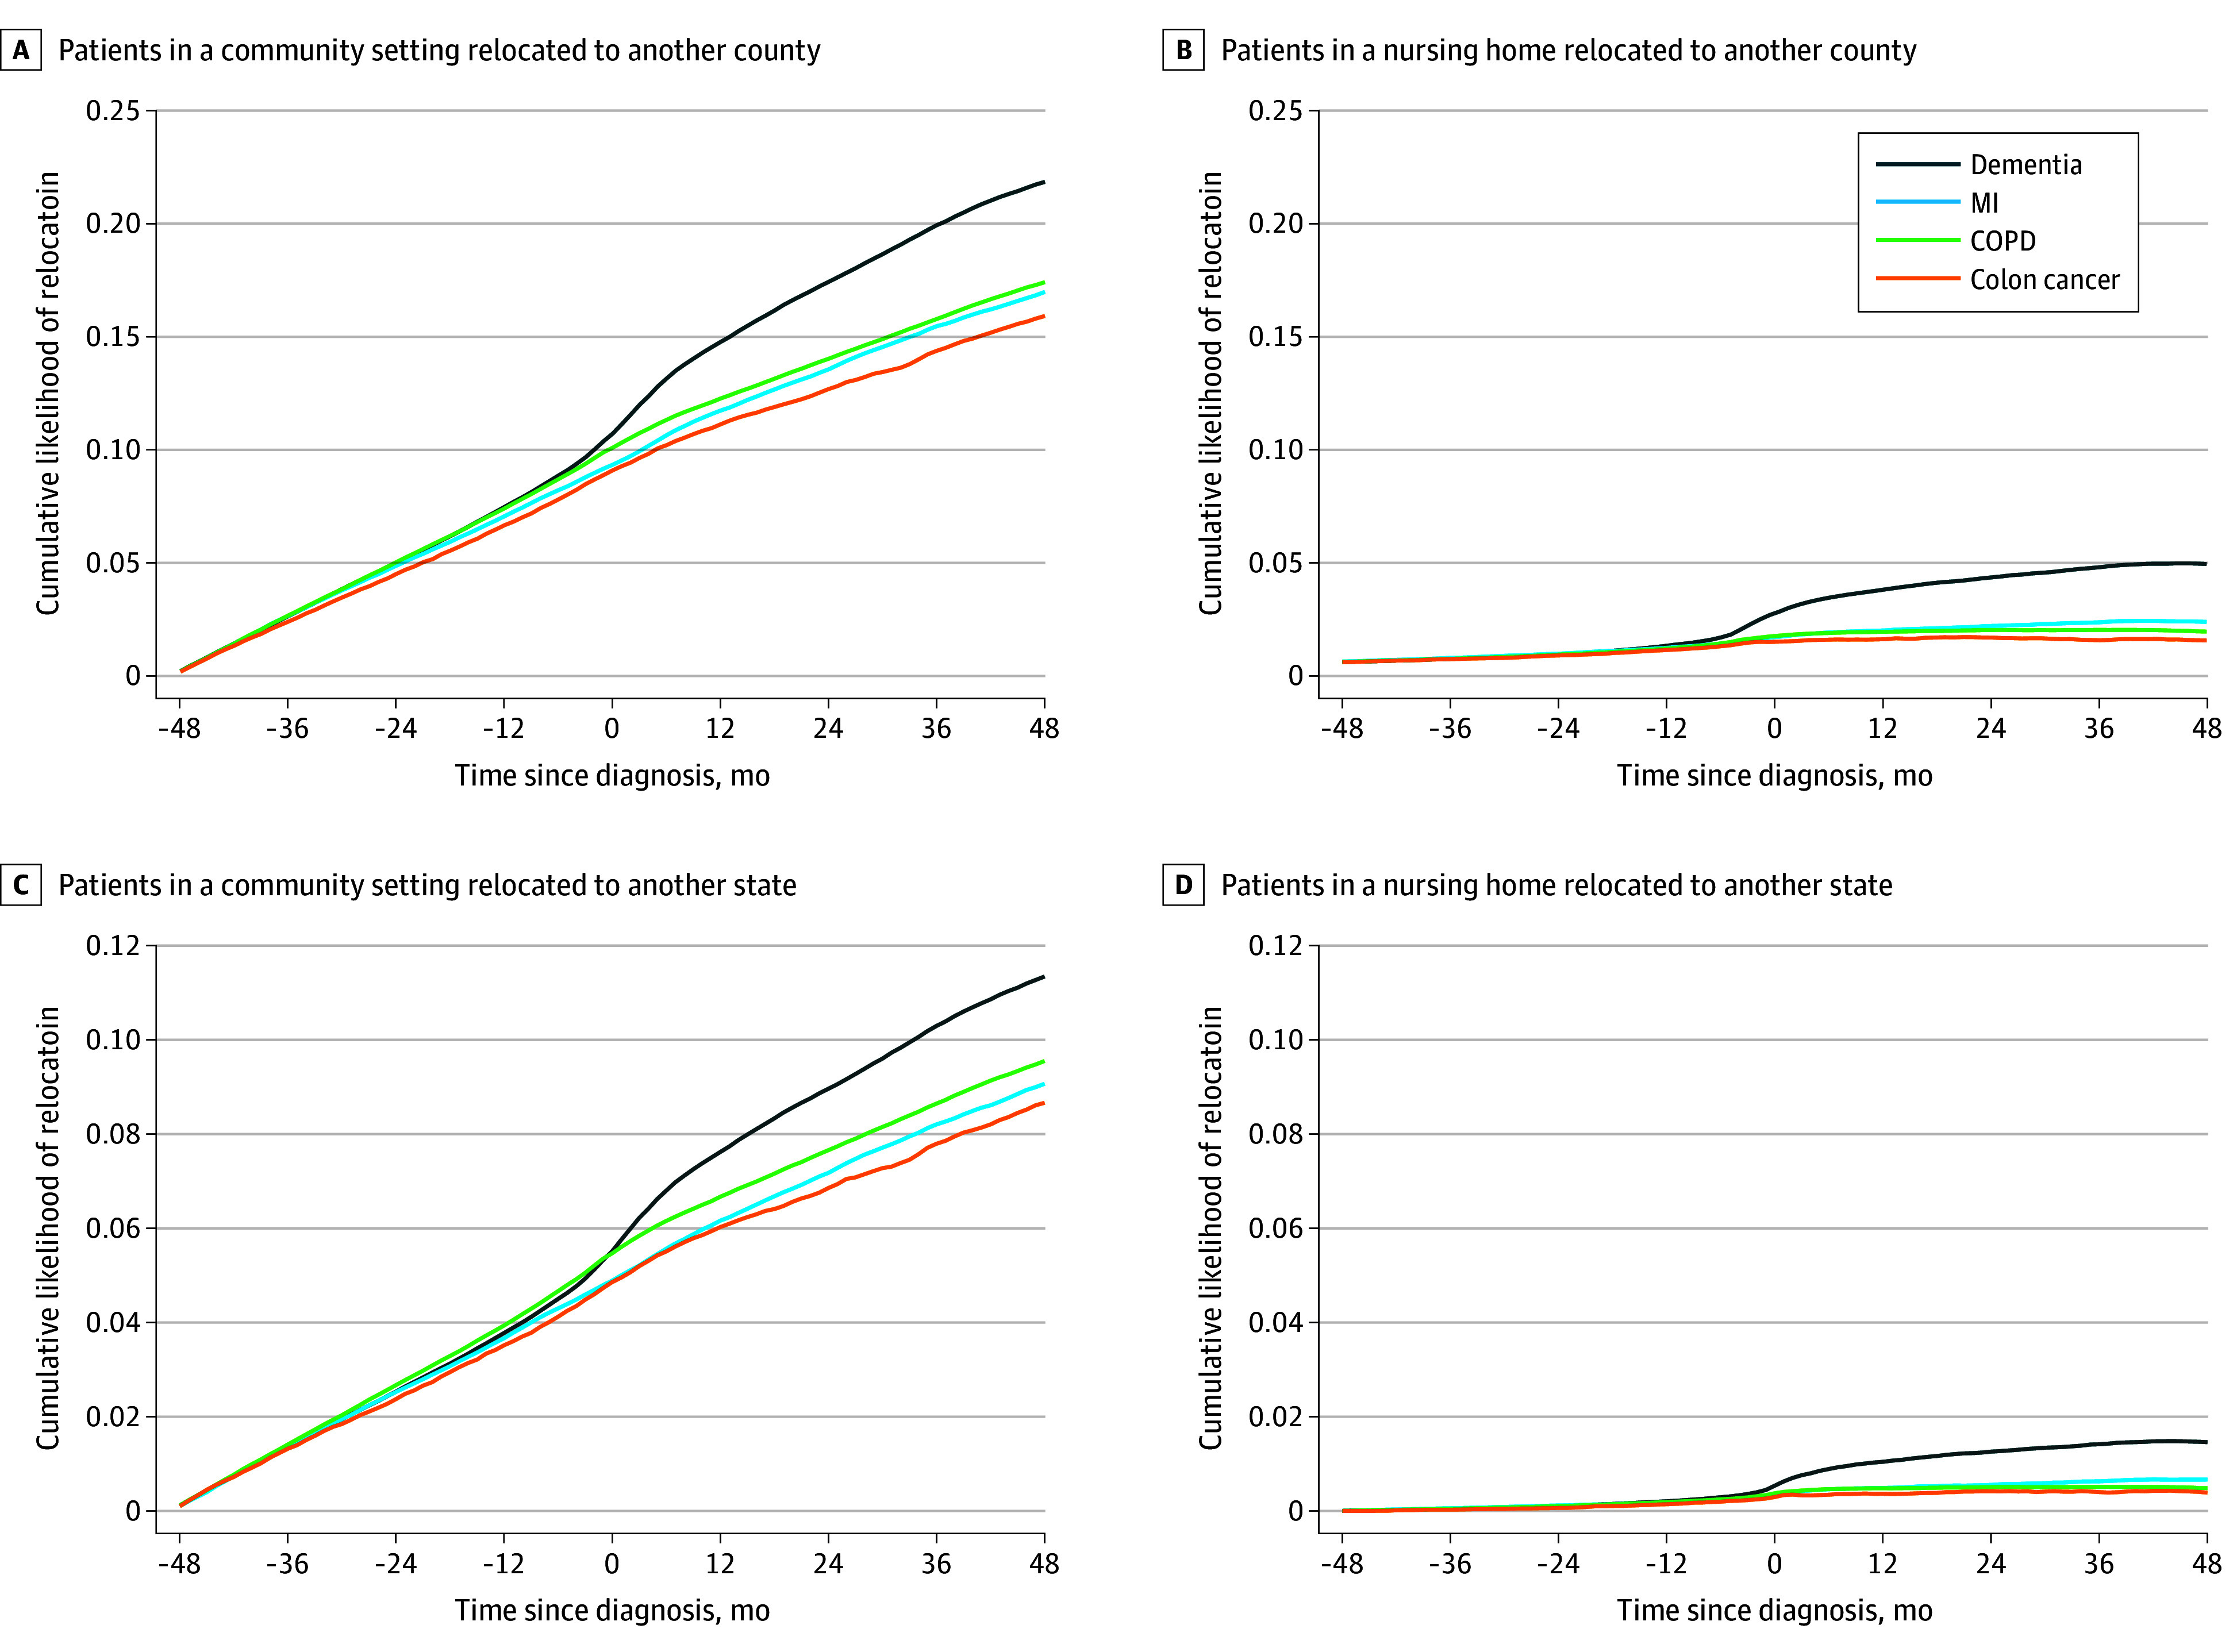
Figure 2. Cumulative Likelihood of Migration Relative to Time of Diagnosis.

Graphs show cumulative likelihood of migration among patients in a community setting migrating to another county (A), patients in a nursing home migrating to another county (B), patients in a community setting migrating to another state (C), and patients in a nursing home migrating to another state (D). COPD indicates chronic obstructive pulmonary disease; and MI, myocardial infarction.
