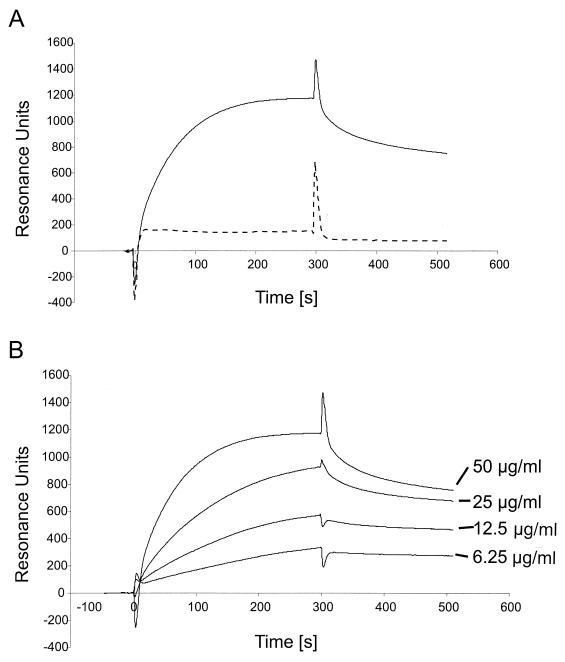
FIG. 5.
(A) Binding of soluble K8.1 to a heparin-coated biosensor measured by SPR. The bindings of K8.1ΔTMFc (solid line) and Fc alone (dotted line) to a heparin biosensor are compared. Binding of K8.1 and Fc is shown as RU versus time in seconds. Both proteins were used at 50 μg/ml and injected at 4 μl/min onto the heparin-coated surface. The protein solution was injected for 300 s, followed by injection of running buffer at 4 μl/min for 250 s. The peak visible at 300 s is due to the change of the refractory index caused by replacing the buffer on the sensor chip. Due to the purification process, the buffer used to apply K8.1ΔTMFc differed slightly from the running buffer. (B) Binding of soluble K8.1 at concentrations of 6.25 to 50 μg/ml to a heparin-coated biosensor chip. K8.1ΔTMFc was injected at 4 μl/min for 300 s and reached a new equilibrium value with each higher concentration. Data from multiple runs without baseline subtraction are given as RU versus time in seconds. The peak at 300 s is due to the change of the refractory index when the protein solution was replaced with running buffer. The kinetic data shown in this figure were used to calculate the dissociation constants shown in Table 1.

