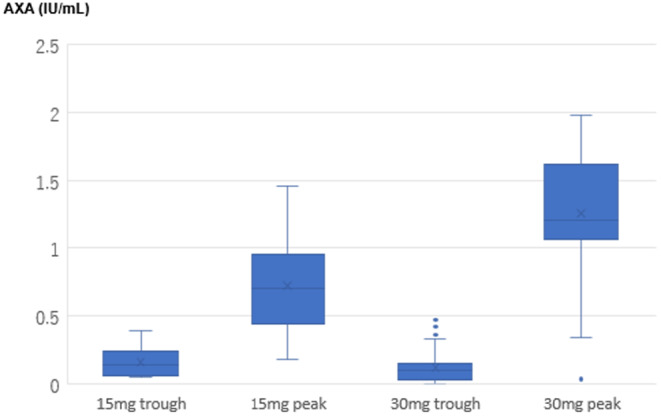
FIGURE 1.

Distribution of steady‐state trough and peak anti‐factor Xa activity (AXA) values of the 15 mg group and the 30 mg group. The trough AXA value did not significantly differ between the groups. On the other hand, the peak AXA in the 15 mg group was significantly lower than that of the 30 mg group. Horizontal line in boxes represents medians. Tops and bottoms of boxes indicate 75th and 25th percentile, respectively. Tops and bottoms of bars indicate maximum and minimum non‐outliers, respectively. Circles indicate outliers above or below 1.5 times interquartile range from the 75th and 25th percentiles.
