. 2024 Oct 8;5(12):1219–1231. doi: 10.1039/d4cb00107a

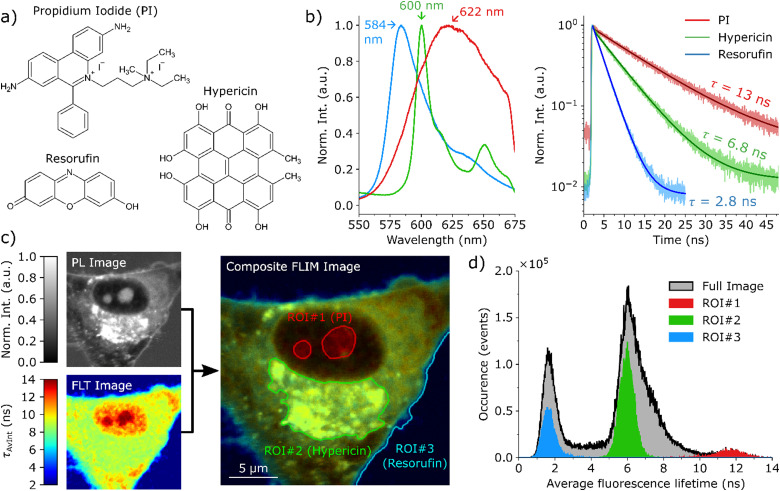
Fig. 1. Characterization of hypericin-induced PDT in single glioma cells. (a) The chemical structures of hypericin, resorufin and PI. (b) The fluorescence spectra and fluorescence decay curves for hypericin (green), resorufin (blue) and PI (red) in medium solution, acquired by excitation with a 405 nm laser. The respective fluorescence lifetimes τ are 2.8 ns for resorufin, 6.8 ns for hypericin and 13 ns for PI. (c) depicts a composite FLIM image of a single glioma cell in an early PDT stage. The composite FLIM image's color is given by the FLT recorded at each pixel, while the brightness is determined by the PL intensity. Three regions of interest (ROI) are indicated in (c), where the fluorescence signal is dominated by one specific dye, [ROI#1 (nucleoli): PI, ROI#2 (ER): hypericin, ROI#3 (medium): resorufin]. The occurrence histograms in (d) display the number of photons that are associated with a certain average FLT for the full image (black) and the ROIs in (c).

Fig. 1