. 2024 Oct 8;5(12):1219–1231. doi: 10.1039/d4cb00107a

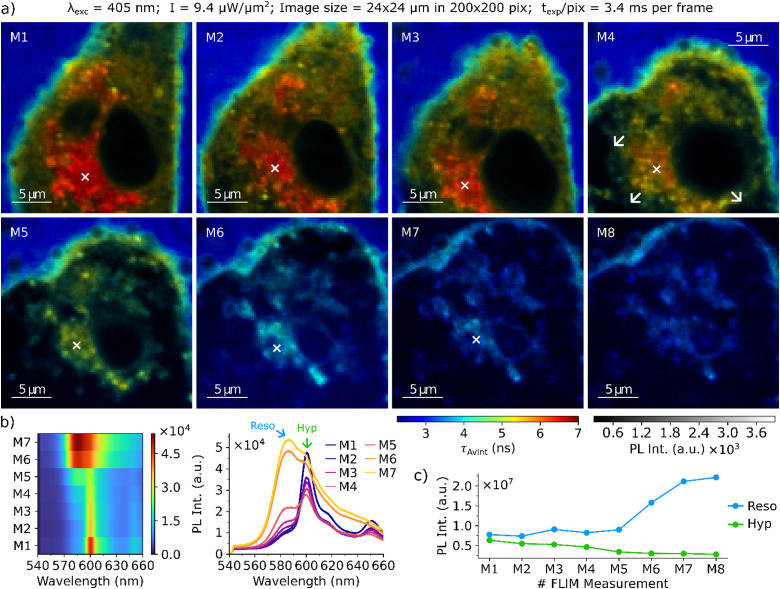
Fig. 2. (a) Composite FLIM image series of a single glioma cell after hypericin incubation and resorufin conversion. Cell contraction and rounding can be observed in M1 to M3, together with a decrease of hypericin PL intensity. Formation of protrusions of the cellular membrane close to the ER is visible in M4. Further swelling until rupture of the cell membrane occurs between M5 and M8. (b) Series of fluorescence spectra acquired in the cell's ER at the locations marked by the white cross in M1–M7. (c) Evolution of the overall fluorescence intensities of hypericin and resorufin recorded in each image of the series. The acquisition parameters of the imaging series are displayed on top of the figure.

Fig. 2