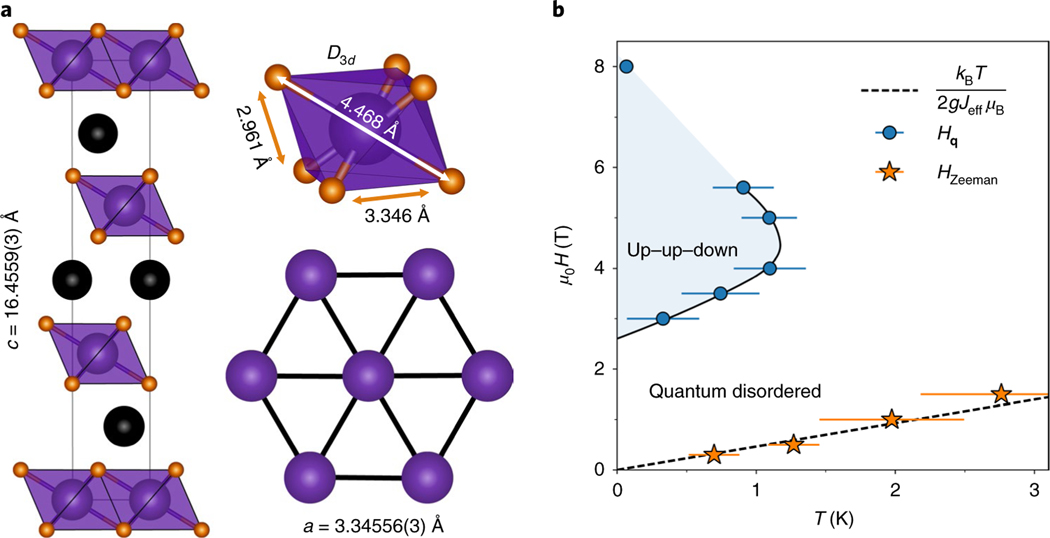
Fig. 1 |. Crystal structure and magnetic (, ) phase diagram of NaYbO2.
a, Refined NaYbO2 structure (1.6 K, R3m) contains equilateral triangular layers of YbO6 distorted octahedra separated by 3.346 Å. Sodium cations refine to full occupation, creating a uniform chemical environment surrounding the triangular layers. Purple spheres, Yb atoms; black spheres, Na atoms; brown spheres, O atoms. b, Low-temperature phase boundary between quantum disordered and antiferromagnetic ordered states in NaYbO2, plotted as a function of field and temperature, extracted from a.c. susceptibility and neutron-scattering experiments. The dashed line denotes the boundary of Zeeman-driven quenching of a minority fraction of free Yb moments under field, above which free moments are quenched. These free moments coexist with a quantum disordered ground state. Values in parentheses and error bars indicate one standard deviation. is the Boltzmann constant, denotes the onset temperature of the up–up–down ordered state and denotes the suppression in magnetic susceptibility observed due to the quenching of a small fraction of free Yb moments.

