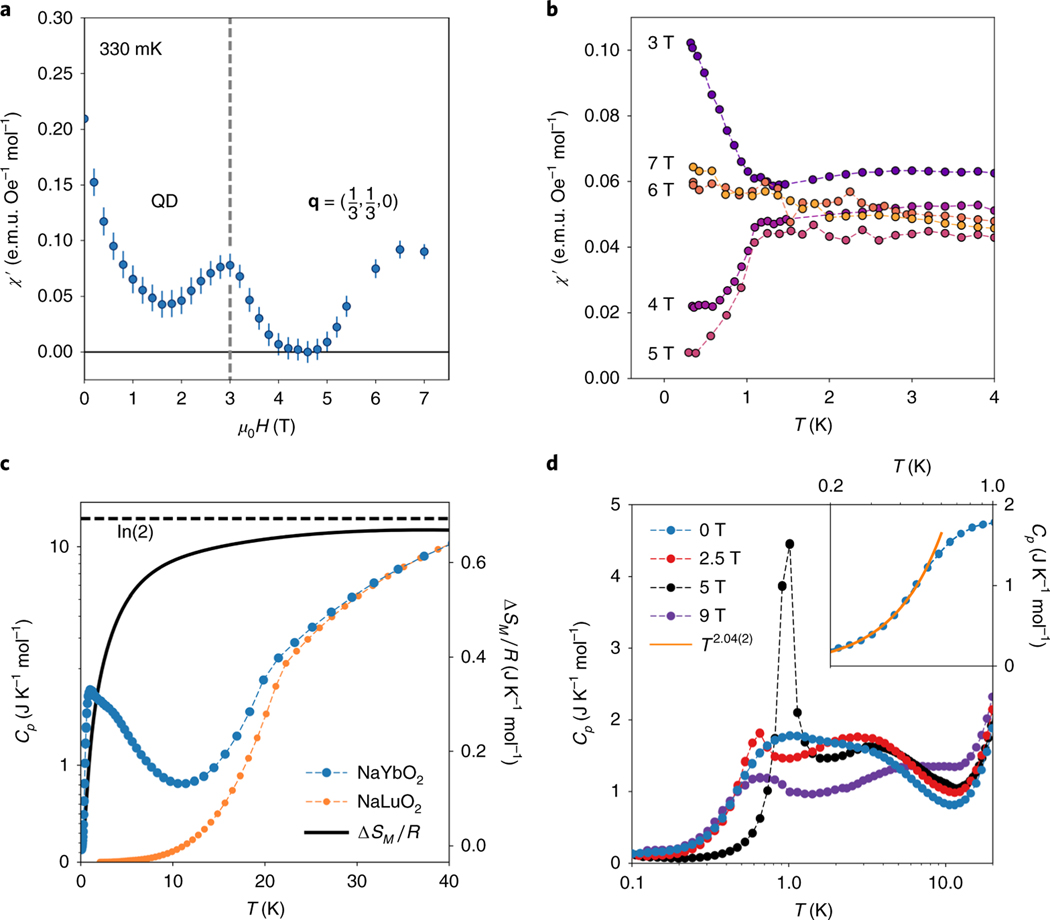
Fig. 3 |. High-field magnetic susceptibility and heat capacity data.
a, data collected at 330 mK showing the phase boundary (dashed line) between the quantum disordered (QD) ground state and magnetically ordered state near 3 T. A second transition back into the quantum disordered state or a quantum paramagnetic phase begins at higher fields. b, data collected under a series of magnetic fields that traverse the ordered state; 4 T and 5 T data illustrate the onset of the ordered phase below 1 K, while 6 T and 7 T data suggest partial re-entry into a disordered magnetic state. c, Specific heat of NaYbO2 measured down to 80 mK under zero field and overplotted with the non-magnetic NaLuO2 analogue. The resulting magnetic entropy approaches 95% of . d, Values of under varying magnetic fields. The lower peak centred around 1K develops a sharp anomaly at 5 T, indicative of the phase transition into the state that is suppressed by 9 T. The inset shows the low-temperature portion of the data fit to a power law. The resulting fit to is shown as a solid yellow line through the data. Error bars denote one standard deviation of the data.

