
Figure 1.
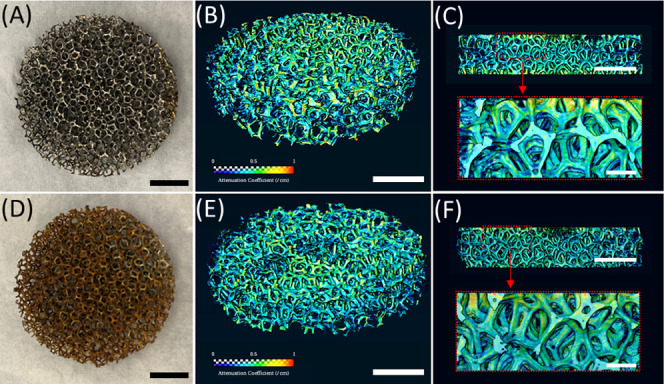
Representative neutron tomograms of porous cylindrical electrodes. A pristine 10 PPI electrode (A, scale bar: 10 mm) was neutron-scanned and three-dimensionally reconstructed (B, scale bar: 10 mm). The neutron attenuation coefficient was represented in a color spectrum scaling from 0 to 1. The reconstructed 3D image enabled internal pore navigation (top image of C, cross-section at the concentric center of B, scale bar: 10 mm) and a local visualization (bottom image of C, zoomed-in image of the red-dotted box of the top image, scale bar: 2 mm). (D, E, and F) Corresponding images of the same electrodes after electrolysis at 1.0 A for 40 min.