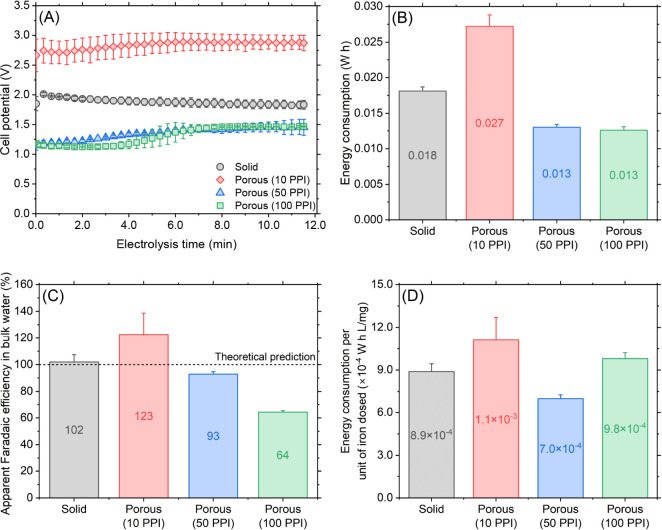
Figure 2.
Electrochemical behavior comparison of solid and porous iron electrodes when electrolysis was performed at 0.05 A for 691 s. (A) Cell voltage history during electrolysis (data points every 20 s are shown so as to clearly see individual data points, error bars, and the overall trend). (B) Electrical energy consumption for electrolysis (all data points measured every second were used for the calculation following eq 1). (C) Faradaic efficiency calculated based on the measured total iron concentration in bulk water and theoretical prediction using Faraday’s law. (D) Electrical energy consumed for unit iron dosing.

