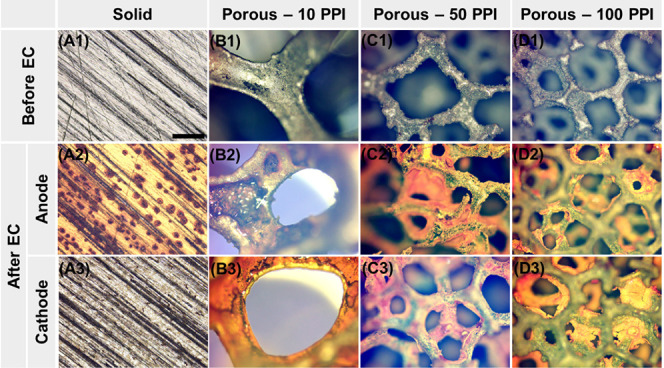
Figure 4.

Optical microscopy of surface morphology changes on solid (A1–A3) and porous Fe electrodes (B1–D3) after electrolysis at 0.05 A for 11.5 min at pH 6.5. The scale bar in A1 represents the 500-μm length and applies to all the images. Note that Figures 4D2 and 4D3 were intentionally focused on the clogged inner pore layer, resulting in blurred images of clean outer pore layers.
