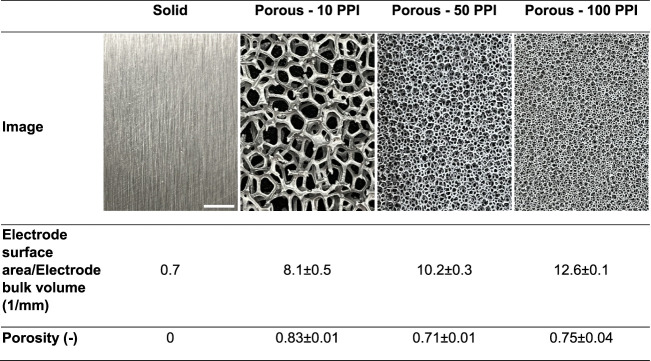
Table 1. Photos of Pristine Solid Iron Plate (Left) and Porous Iron Foam Electrodes of Varying Porosity (Expressed in Pores Per Inch, i.e., PPI) Used in This Studya.
The scale bar in the far-left panel represents 5 mm and applies to all the other panels. Structural properties of electrode surface area/electrode bulk volume and porosity are also presented based on the tomography results.

