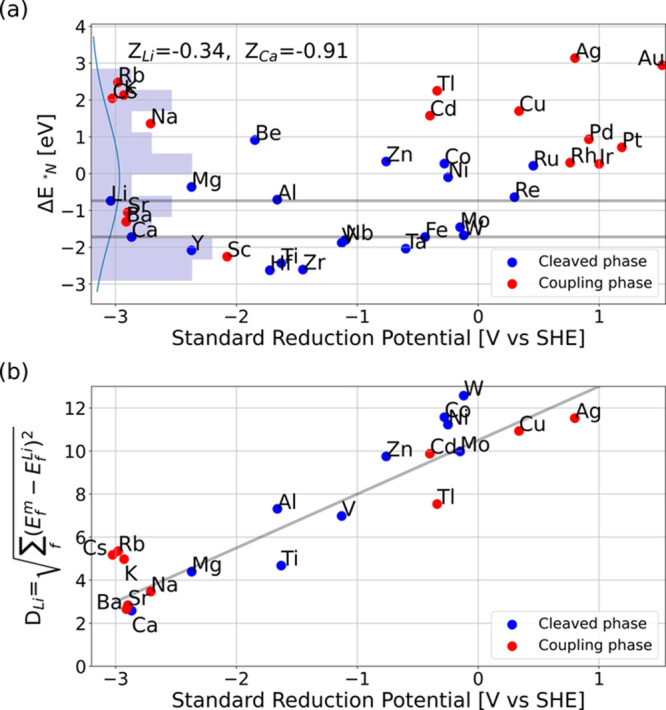
Figure 1.

(a) Calculated binding energies of nitrogen (ΔE*N) versus standard reduction potential. Horizontal lines indicate Li and Ca (working electrodes). A histogram and a probability density distribution are plotted together with the Z-score values. Neither Li nor Ca is exceptional in that regard, as a Z-score >2 gives a data point outside of 95% of the data assuming a normal distribution. (b) Calculated distance to Li, with m being the metals and f the features, such as the formation energies and binding energies, plotted as a function of the standard reduction potential. Ca is the material closest to Li, and with increasing standard potential the further away the materials energetics are. “Cleaved phase” means that the material forms a nitride phase with isolated nitrogen atoms.
