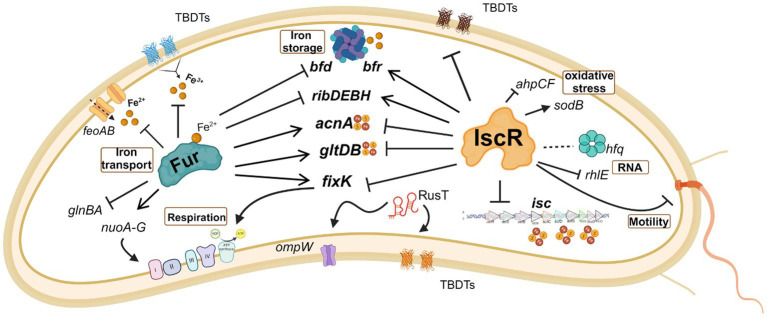
Figure 10.
Schematic representation of some of the processes regulated by IscR and/or FUR. The effect of the regulator in gene expression is indicated as activation (arrow heads) or repression (blunt heads). Traced lines indicate that the result of the regulation (activation or repression) is unknown. The red and yellow circles symbolize the Fe-S clusters. Note that although IscR is showed without the Fe-S group, it may bind as a holo-protein to some operators. Created in BioRender. Santos, N. (2024) BioRender.com/o32b986.

