Figure 6.
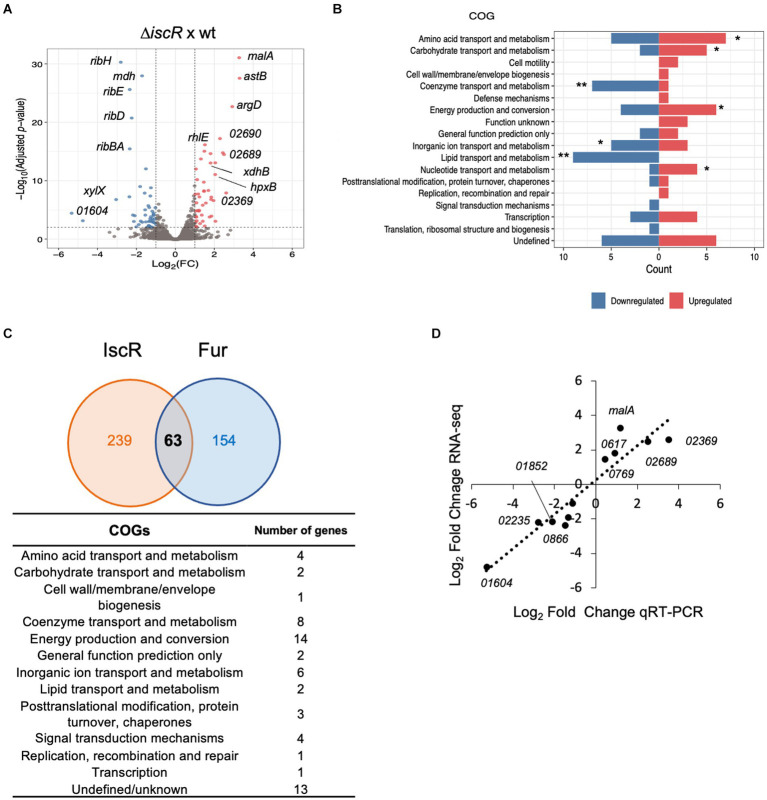
Global transcriptomic analysis of the IscR regulon. (A) Volcano plot with the distribution of DEGs in the ΔiscR versus wt. Colored dots indicate genes that were differentially expressed in the mutant: blue, downregulated; red, upregulated. (B) Functional characterization of DEGs obtained according to the Cluster of Orthologous Genes (COG). The categories defined to be overrepresented in each analysis are those with the Benjamini-Hochberg adjusted p-value <0.05, as indicated: * adjusted p-value <0.05; ** adjusted p-value <0.01. (C) Intersection between the predicted C. crescentus IscR and Fur regulons. The number of genes comprising the IscR regulon was calculated as a sum of the DEGs identified in the RNA-seq experiment and genes with an upstream peak of IscR binding, identified in the ChIP-seq experiment. The Fur regulon was obtained from (6, 26, 27). All the genes in the operons were considered in this comparison. The categories of the genes predicted to belong to both regulons were obtained according to COG. (D) The relative amount of mRNA for several DEGs in the wt and in the ΔiscR mutant was determined by RT-qPCR using primer pairs that amplify each ORF. A correlation analysis between the differential expression obtained by RNA-seq and RT-qPCR is shown (2 biological samples and 2 technical samples).

