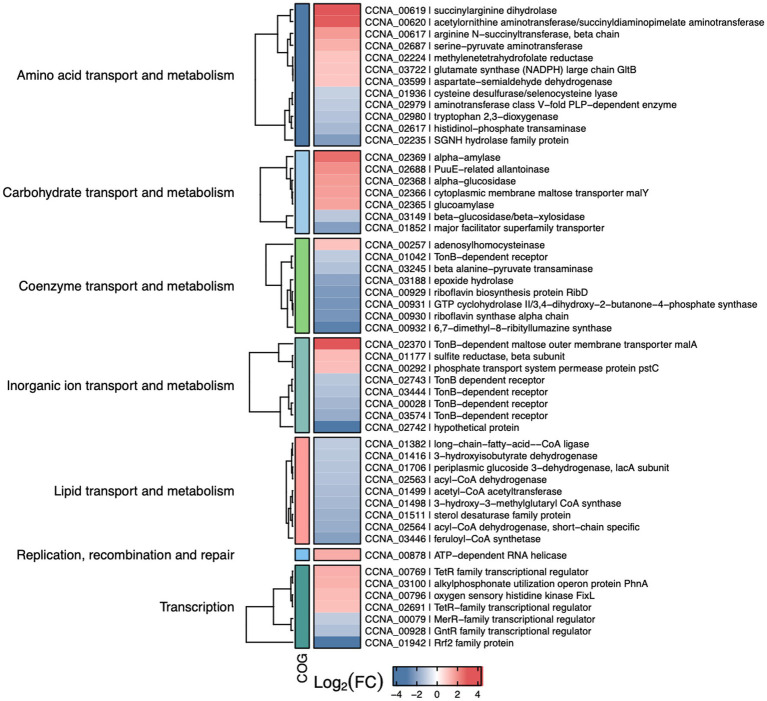
Figure 7.
Selected differentially expressed genes in the iscR mutant. Heat map showing some of the DEGs determined by RNA-seq analyses of ΔiscR x wt. The colors indicate the log2[Fold Change] according to the legend at the bottom and the description of the categories on the left. “Figure made using R package ComplexHeatmap (ref – https://academic.oup.com/bioinformatics/article-abstract/32/18/2847/1743594).

