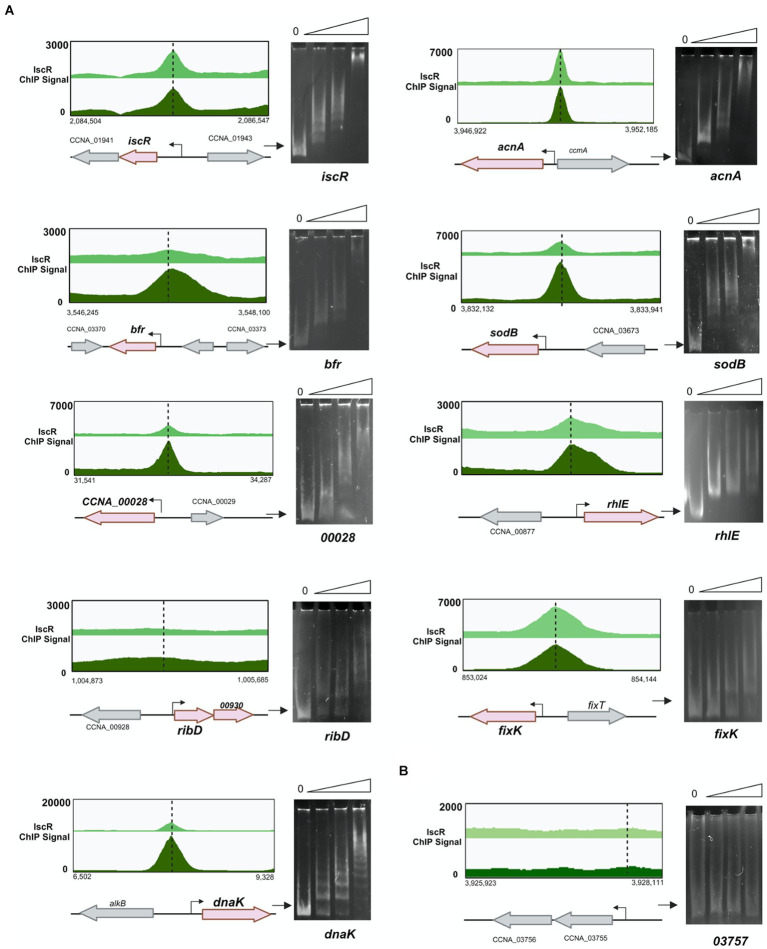
Figure 9.
IscR binds to regulatory regions of several targets identified by ChIP-Seq. (A) Representative scheme of the peaks obtained for IscR-bound DNA reads in the ChIP-Seq experiment from cultures in PYE medium (light green) or PYE + DP (dark green) visualized by the Integrated Genome Browser. Electrophoresis Mobility Shift Assay (EMSA) experiments using DNA probes corresponding to each peak are shown at the right of the respective scheme. Probes were incubated with increasing concentrations (0–50–100-250 nM) of the purified IscR protein, as shown above each figure. Gels were stained with ethidium bromide. (B) The promoter region of gene CCNA_03757 was used as a negative control. The arrow indicates the free probes. Created in BioRender. Santos, N. (2024) BioRender.com/x20p050.

