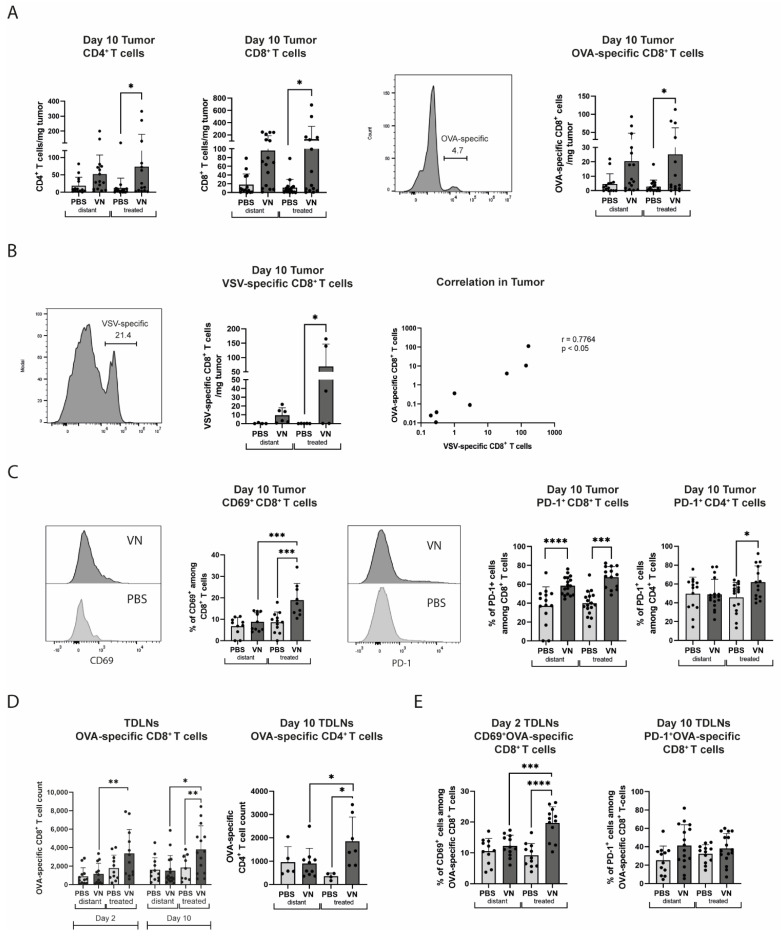
Figure 2.
VSV-NDV treatment leads to T cell activation in tumors and lymph nodes. Bilateral B16OVA-bearing mice were treated intratumorally with VSV-NDV or PBS and analyzed by flow cytometry. (A) CD8+, CD4+, and OVA-TCR+CD8+ T cells in the tumor on day 10. (B) VSV-TCR+CD8+ T cells and the correlation of VSV+TCR and OVA+TCR in the tumor on day 10. (C) CD69 expression on CD8+ T cells on day 10 in the tumor and PD-1 expression on CD4+ and CD8+ T cells on day 10 in the tumor. (D) OVA-TCR+CD8+ or OVA-TCR+CD4+ T cells on day 2 and day 10. (E) CD69 expression on day 2 and PD-1 expression on day 10 of OVA-TCR+CD8+ T cells. N = 5–15 mice; data points indicate values of individual replicates (and group means + SD are presented as bars); * indicates p ˂ 0.05, ** p ˂ 0.01, *** p ˂ 0.001, **** p ˂ 0.0001.

