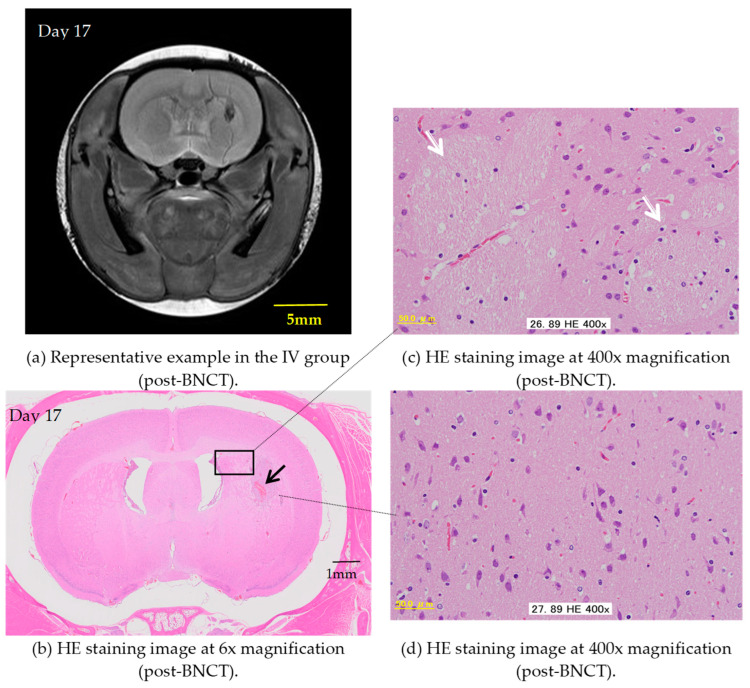
Figure 4.
The figures represent an example of the IV group. (a) T2WIs after BNCT. (b–d) Show thin sections of rat brain tissue stained with HE depicting the brain’s condition after BNCT with the IV administration of BPA. (b) Shows 6× magnification under a microscope. Some hemorrhaging (⟶) is observed in the striatal area, but there is minimal evidence of inflammatory cell infiltration. (c) Shows 400× magnification under a microscope (the area enclosed by the rectangle in Figure (b)). The image indicates that the fiber bundles in the cerebral cortex near the hemorrhagic lesion (⇨) are at normal levels. (d) Shows 400× magnification under a microscope. Unlike the other samples, no signs of demyelination are observed in this specimen.

