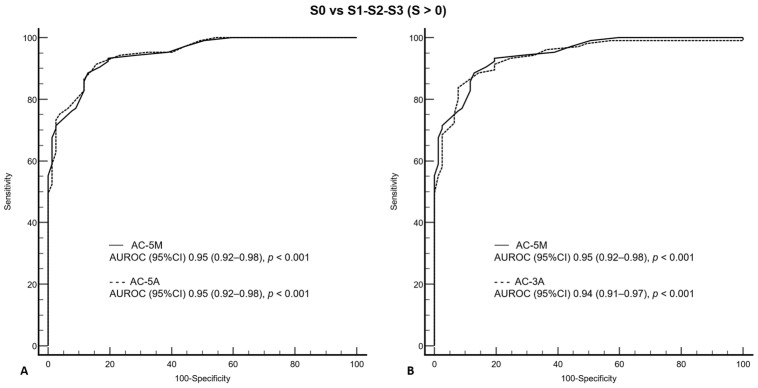
Figure 5.
Comparison of receiver operating characteristic curves for AC-5M and AC-5A (A), and for AC-5M and AC-3A (B) for S0 vs. S1–S3, as defined by MRI-PDFF ≥ 6%. AC-5M, attenuation coefficient (median of five measurements); AC-5A, attenuation coefficient (average of five measurements); AC-3A, attenuation coefficient (average of three measurements); AUROC, area under the receiver operating characteristic (curve); CI, confidence interval; MRI-PDFF, magnetic resonance imaging proton density fatty fraction; p, probability of α type I error.

