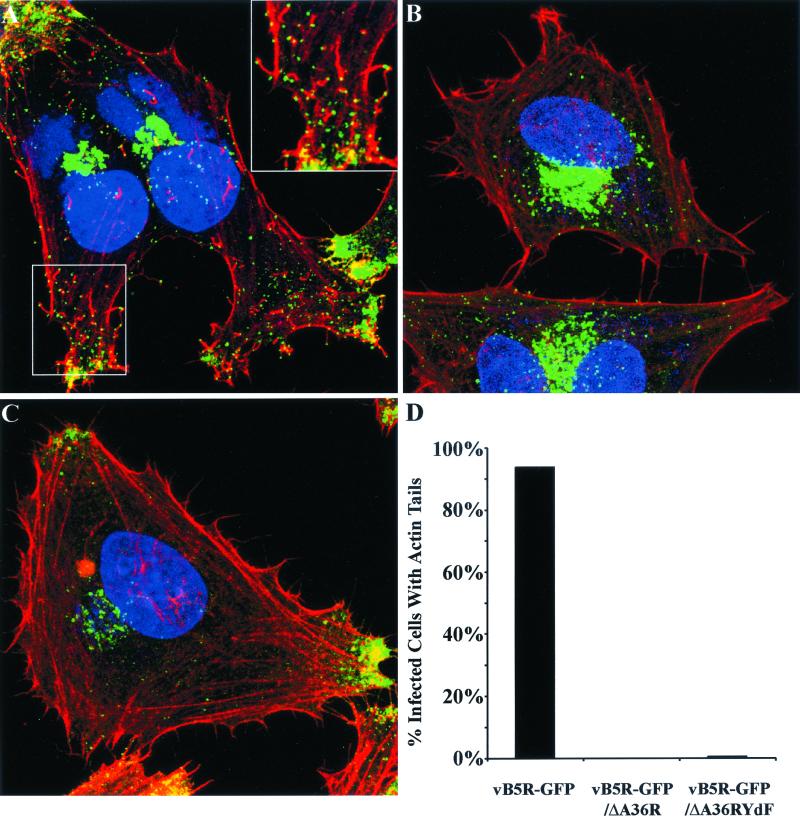
FIG. 8.
Visualization of actin tails by confocal microscopy. (A to C) HeLa cells were infected with vB5R-GFP (A), vB5R-GFP/ΔA36R (B), or vB5R-GFP/A36R-YdF (C) and stained with rhodamine-phalloidin (red) and DAPI (blue) to visualize F-actin and DNA, respectively. Green is GFP fluorescence. The boxed area in the lower left of panel A is enlarged in the upper right in order to more clearly see actin tails. (D) The percentages of infected cells that contained one or more actin tails were determined.

