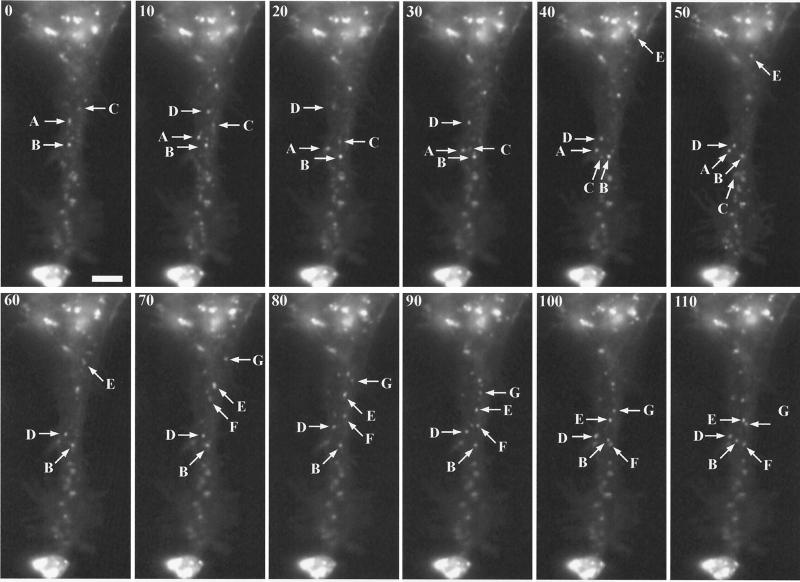
FIG. 9.
Visualization of IEV by digital video microscopy. HeLa cells were infected with 0.2 PFU of vB5R-GFP/A36R-YdF per cell. After 12 h, images were collected at one frame per second. Selected frames are shown, with the cumulative time elapsed (in seconds) indicated in the upper left corner. The lettered arrows in each frame point to the same IEV particles moving downwards in subsequent frames. Note the intense fluorescence, at the bottom of each panel, where IEV accumulate at the vertex of the cell. Bar, 5 μm. The entire time-lapse video is provided as Supplemental Material no. 2 at http://www.niaid.nih.gov/dir/labs/lvd/moss.htm.

