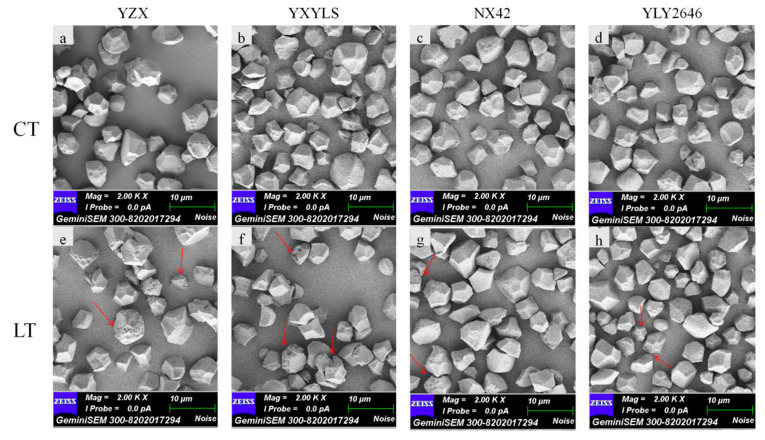
Figure 2.
Effects of low temperature during grain filling on starch scanning electron photomicrographs. Note: (a,e) indicate CT, LT of YZX, respectively; (b,f) indicate CT, LT of YXYLS, respectively; (c,g) indicate CT, LT of NX42, respectively; (d,h) indicate CT, LT of YLY2646, respectively. The red arrows mean microporous starch granules. Scale bar = 10 μm.

