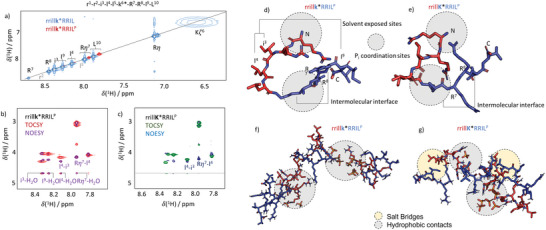
Figure 5.

a) HN‐region of 1H‐1H TOCSY spectra of rrillk*RRIL 7 in water (blue) and PBS (red). The resonance assignment is indicated. The resonance of K6 is heavily broadened due to rapid proton exchange. Dissolution in PBS leads to a disappearance of most resonances. b) HN/Hα‐region of 1H‐1H TOCSY (red) and NOESY (purple) spectra of 7 in PBS. Residues i3, l4, I9, and the side chain of R7 indicate solvent exposure through NOE and/or exchange‐based cross‐peaks with the water resonance. c) HN/Hα‐region of 1H—1H TOCSY (red) and NOESY (purple) spectra of rrillK*RRIL 4 in PBS. In contrast to 7, no water interaction can be observed. d) Simulated structure of 7 in PBS. The l‐ and d‐blocks are indicated by the red/blue color code. N‐ and C‐termini are labeled. Note the hinge involving the k6 isopeptide bond. e) Simulated structure of 4 in PBS. f) Aggregate structure found in MD simulations of 5 copies of 7 in PBS. The gray circles indicate salt bridges formed by the phosphate ions and positively charged arginines. g) Same as in panel (f), but for 4. Besides the salt bridges, hydrophobic side‐chain contacts (yellow circles) cause compaction of the aggregates.
