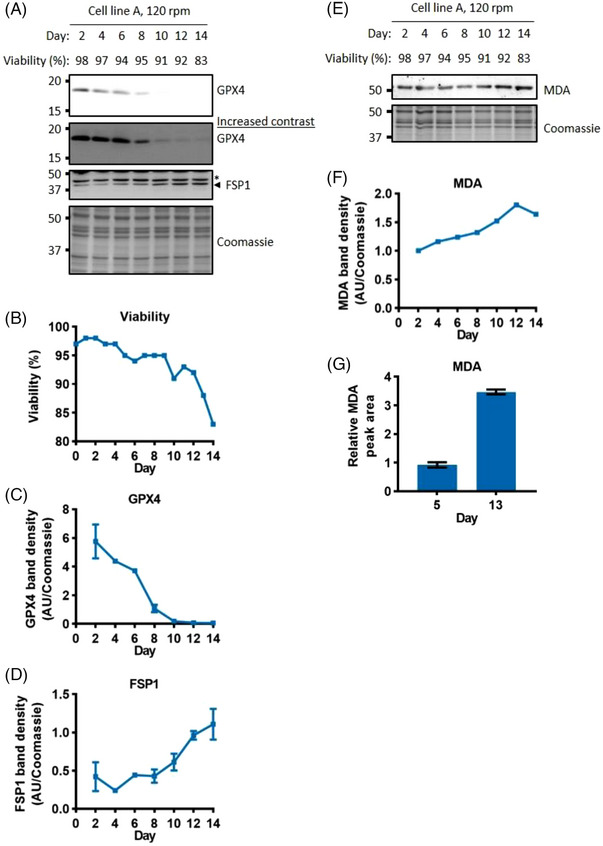
FIGURE 5.

Markers of ferroptosis are associated with a decline in viability. Western blot analysis of ferroptosis suppression enzymes, GPX4 and FSP1 (A). Viability through the fed‐batch culture (B). Quantification of GPX4 and FSP1 (C, D), error bars represent ± SD of two technical replicates, western blot signals on each day were normalised to the day 8 and day 14 values respectively. Western blot analysis and quantification (due to discontinuation of the antibody only one technical replicate was performed) of lipid peroxidation marker MDA (E, F). Quantification of MDA using LC‐MS (G), error bars represent ± SD of three technical replicates. Whole cell lysate was separated using SDS‐PAGE gel electrophoresis. * = Non‐specific band.
