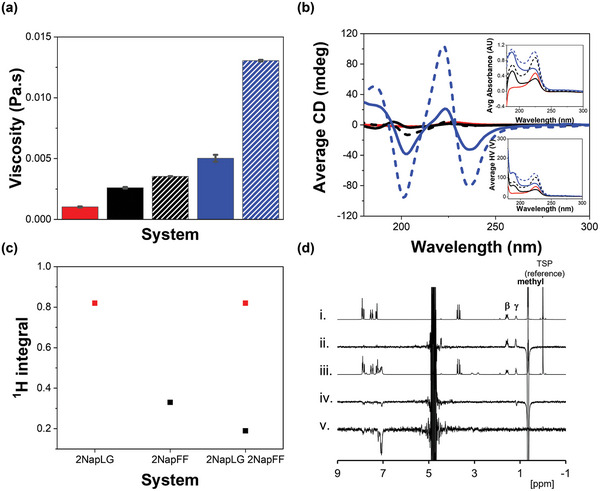
Figure 2.

a) Average viscosity values recorded at a shear rate of 10 s−1 and b) CD spectra recorded for each system in H2O at pH 10.5; 2NapLG 2.5 mg mL−1 (red), 2NapFF 2.5 mg mL−1 (black), 2NapLG 2.5 mg mL−1:2NapFF 2.5 mg mL−1 (black dashed), 2NapFF 5 mg mL−1 (blue) and 2NapLG 2.5 mg mL−1:2NapFF 5 mg mL−1 (blue dashed). Viscosity data were recorded at a temperature of 25 °C in duplicate with a fresh sample for each repeat. The error bars show the standard deviation between the samples. CD data were recorded in triplicate on the same sample and averaged. The inserts show the absorbance (top) and HV (bottom) spectra recorded concurrently with the CD spectra. c) 1H integrals recorded from 2NapLG 2.5 mg mL−1, 2NapFF 5 mg mL−1 and 2NapLG 2.5 mg mL−1:2NapFF 5 mg mL−1. The integrals from the methyl group on 2NapLG are shown in red and those from the CH2Ph group on 2NapFF are shown in black. Integrals were normalized to the resonance from the TSP internal reference. All NMR spectra were collected at 25 °C using H2O as a solvent. d) 1H NMR spectra of: i) 2NapLG 2.5 mg mL−1 ii) 2NapLG 2.5 mg mL−1 showing the NOE difference when methyl resonance inverted, iii) 2NapLG 2.5 mg mL−1:2NapFF 5 mg mL−1 and, iv,v) 2NapLG 2.5 mg mL−1:2NapFF 5 mg mL−1 showing the NOE difference when methyl resonance inverted (iv) and when phenylalanine aromatic resonance inverted (v).
