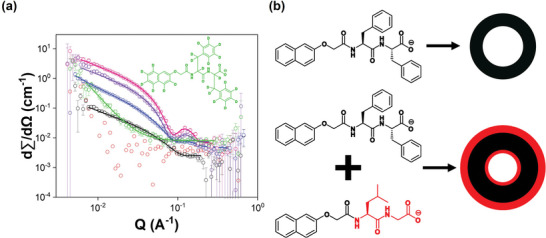
Figure 3.

a) Plots of SANS data (circles) from 2NapLG 2.5 mg mL−1 (red), 2NapFF 2.5 mg mL−1 (black), 2NapLG 2.5 mg mL−1:2NapFF 2.5 mg mL−1 (blue), 2NapFF 5 mg mL−1 (pink), 2NapLG 2.5 mg mL−1:2NapFF 5 mg mL−1 (purple) and 2NapLG 2.5 mg mL−1:d2Nap‐dd‐FF 5 mg mL−1 (green). The fits are shown as solid lines. b) Schematic representation of how the systems studied here self‐assemble, looking down the length of the hollow cylinders formed.
