
Figure 2.
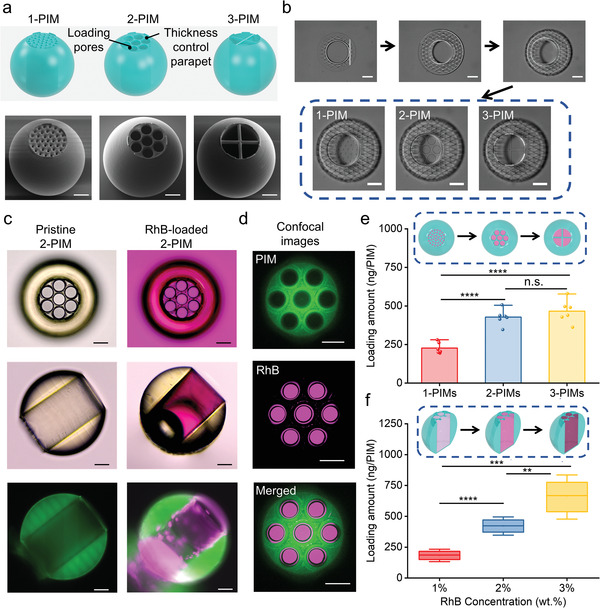
Fabrication and drug loading of the microrobotic system. a) Structure design of 1‐PIM, 2‐PIM, and 3‐PIM with different pore sizes (top). SEM images of single PIMs on substrates from the tilted view (bottom). From left to right, 1‐PIM, 2‐PIM, and 3‐PIM. b) Snapshots of the 3D microfabrication process of PIMs with different top porosity sizes and structures: construction of the PIM body (top) and three kinds of lids (bottom). c) Images of a pristine 2‐PIM (left) and a RhB‐loaded 2‐PIM (right). From top to bottom: top‐view bright‐field microscopy images (top), side‐view bright‐field microscopy images (middle), and side‐view fluorescence microscopy images (bottom). d) Confocal laser scanning microscopy images of a RhB‐loaded 2‐PIM. From top to bottom: photoresist channel (top), RhB channel (middle), and merged (bottom) images. e) RhB loading quantity for 1‐PIM, 2‐PIM, and 3‐PIM under the same loading process and loading solution (2 wt% RhB). All values are expressed as mean ± SD, n = 6, significance determined by an unpaired, two‐tailed t‐test, Student's t‐test, **** p = 0.000015 for 1‐PIMs versus 2‐PIMs, **** p = 0.000033 for 1‐PIMs versus 3‐PIMs, p = 0.319275 for 2‐PIMs versus 3‐PIMs. f) Loading quantity for 2‐PIMs using RhB solutions with different concentrations. All values are expressed as mean ± SD, n = 6, significance determined by an unpaired, two‐tailed t‐test, Student's t‐test, **** p = 0.000002 for 1% versus 2%, ** p = 0.003309 for 2% versus 3%, *** p = 0.000106 for 1% versus 3%. Scale bars = 50 µm.