
Figure 4.
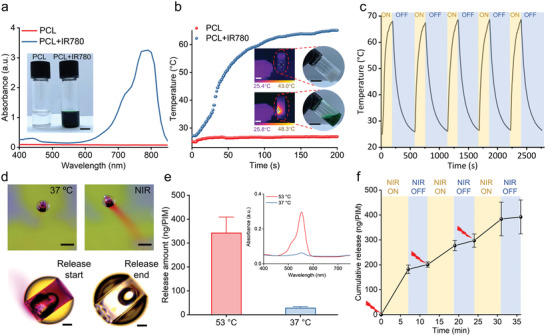
Drug release capability of the microrobotic system. a) UV–vis–NIR absorption spectra of PCL and PCL‐IR780. The inserted images show the PCL diol and PCL diol with IR780. Scale bar = 1 mm. b) Photothermal heating curves of PCL and PCL‐IR780 under NIR laser irradiation (808 nm, 0.6 W cm−2) over 200 s. The inset images are infrared thermal images under laser exposure (left) and photos after irradiation (right) of PCL (top) and PCL‐IR780 (bottom). Scale bars = 2 cm. c) Temperature variation of PCL‐IR780 under five cycles of NIR laser irradiation and cooling. d) Top: Photos of 2‐PIM at 37 °C (left) and after NIR laser irradiation (right). Scale bars = 300 µm. Bottom: Bright‐field microscopy images of the 2‐PIM before (left) and after (right) release. Scale bar = 50 µm. e) The release amount of RhB after long‐term incubation at 37 and 53 °C. All values are expressed as mean ± SD, n = 6. Inset figure shows the UV–Vis spectra of the solutions after incubating the PIMs at 37 and 53 °C. f) On‐demand release of RhB from 2‐PIMs under the triggering of on/off switching NIR laser. All values are expressed as mean ± SD, n = 3.