
Figure 5.
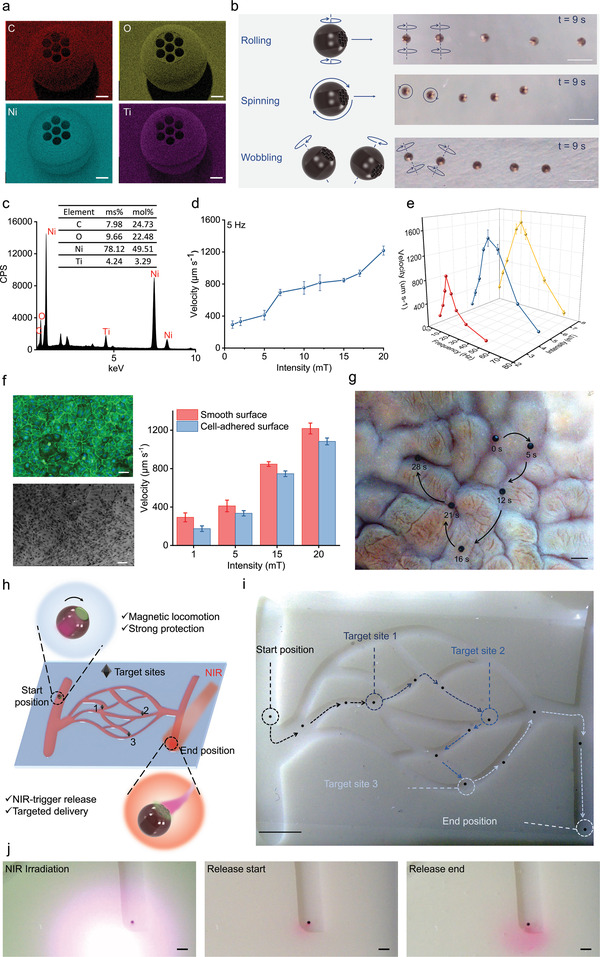
Locomotion, targeting, and on‐demand drug delivery of the microrobotic system. a) EDX mapping of the PIMs after Ni/Ti physical vapor deposition. Red: carbon, yellow: oxygen, cyan: nickel, purple: titanium. Scale bars = 50 µm. b) Schematic of superimposed snapshots of PIMs following three different motion modes under a rotating magnetic field. The PIMs were observed from a top view. Scale bars = 500 µm. c) EDS of PIMs after Ni/Ti deposition showing mass fractions (wt%) and atom fractions (at%) of C, O, Ni, and Ti. d) PIM motion velocity under different rotating magnetic field intensities (1–20 mT, frequency fixed at 5 Hz). All values are expressed as mean ± SD, n = 3. e) PIM motion velocity at different rotating magnetic field frequencies (1–70 Hz, intensity fixed at 2.5, 5, and 7.5 mT). All values are expressed as mean ± SD, n = 3. f) The CD31/DAPI staining confocal image (upper left, scale bar = 50 µm) and SEM image (lower left, scale bar = 100 µm) of the cell‐adhered surface. The velocities of PIMs on cell‐adhered surfaces versus smooth surfaces under different rotating magnetic field intensities (5 Hz, 1–20 mT). All values are expressed as mean ± SD, n = 3. g) Snapshots of the motion of PIMs on an ex vivo pig stomach. Scale bar = 1 mm. h) Schematic of the on‐demand targeted delivery of cargos by PIMs in a 3D‐printed chip with vessel‐like fluidic channels. i) Controlled locomotion of the PIM along the designated trajectory under the rotating magnetic field in the sinuous channels. Scale bar = 5 mm. j) Images of the end position with NIR laser: after application of NIR laser, a red cloud of RhB cargo was delivered to the targeted area. Scale bars = 1 mm.