. 2024 Oct 15;3(10):pgae393. doi: 10.1093/pnasnexus/pgae393

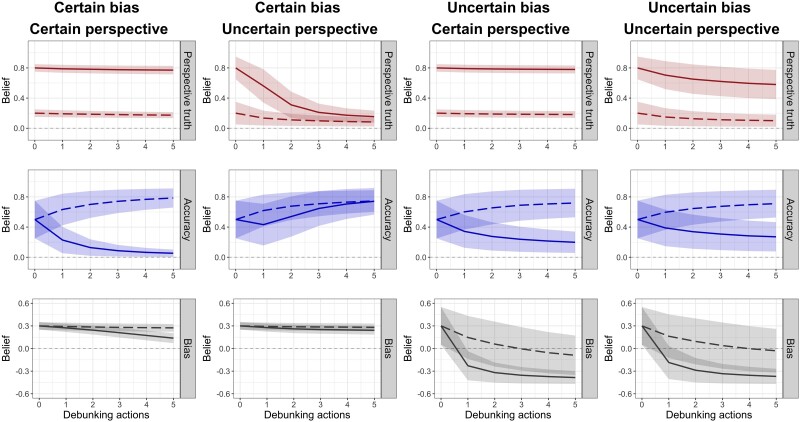
Fig. 5.

Twelve line charts arranged in four columns of three charts each. Each chart has two lines plotted on it, one solid and one dashed. Each line has a shaded area around it representing uncertainty. Starting from the left, the first column is labeled “Certain Bias, Certain Perspective”, the second column is labeled “Certain Bias, Uncertain Perspective”, the third column is labeled “Uncertain Bias, Certain Perspective”, and the fourth column is labeled “Uncertain Bias, Uncertain Perspective”. The top row of charts shows beliefs about the truth of the perspective. The middle row shows beliefs about the authority’s accuracy. The bottom row shows beliefs about the authority’s bias. See description comparing the results for the four scenarios in the main text.

Interaction between bias belief uncertainty and perspective belief uncertainty in determining the polarization of beliefs. In all four simulations, both subgroups are initially uncertain that the authority is somewhat accurate (mean = 0.5, std = 0.25), and both subgroups believe the authority is biased in favor of the target. Certain and uncertain perspective beliefs correspond to standard deviations of 0.05 and 0.15, respectively. Certain and uncertain bias beliefs correspond to standard deviations of 0.05 and 0.25, respectively.