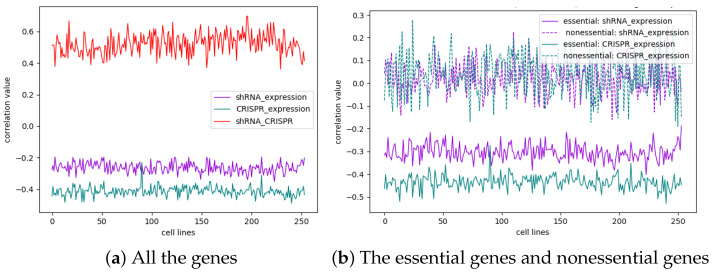
Figure 4.
(a), The correlation coefficient between the essentiality score and gene expression in the original data for all the genes in each cell line. The purple curve corresponds to shRNAs with an average value of −0.263, and the green curve corresponds to CRISPR with an average value of −0.413. The red curve shows the correlation between shRNA and CRISPR with an average value of 0.523. (b), The correlation coefficient between the essentiality score and gene expression for essential genes and nonessential genes in each cell line. The average correlation coefficient between the shRNA essentiality score and gene expression was −0.304, the average correlation coefficient for CRISPR was −0.435, and the average correlation coefficient for nonessential genes on both shRNA and CRISPR was approximately 0.

