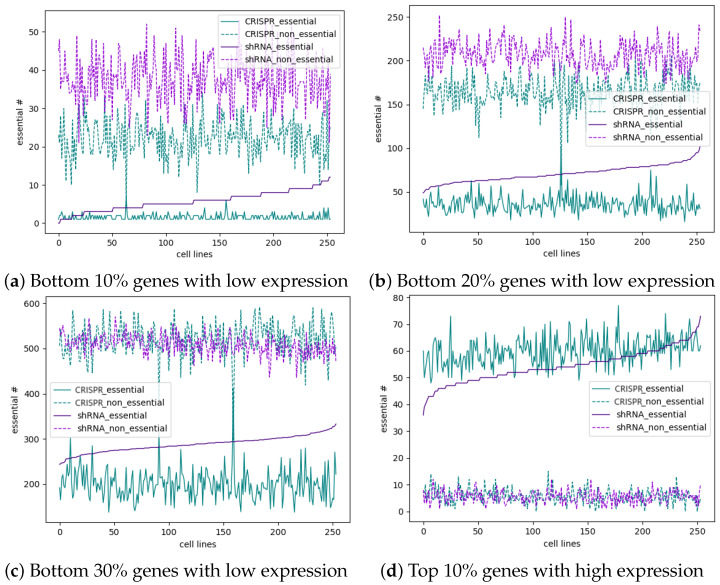
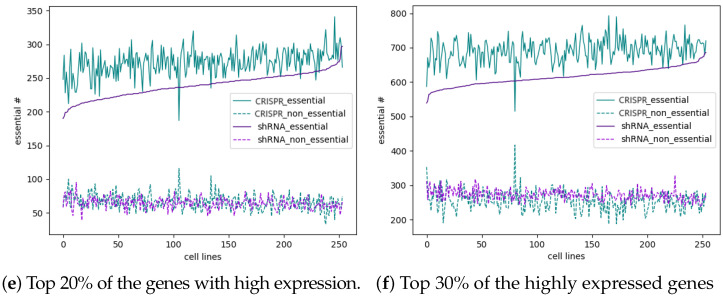
Figure 6.
Comparison of the number of highly expressed essential (nonessential) genes and genes with low expression of essential (nonessential) genes identified by shRNA and CRISPR in each cell line. (a–c) show the number of essential and nonessential genes identified by shRNA and CRISPR in the top 10%, 20%, and 30%, respectively, of the genes with the lowest expression in each cell line. (d–f) show the numbers of essential genes and nonessential genes identified by shRNA and CRISPR in the top 10%, 20%, and 30%, respectively, of the genes most highly expressed in each cell line.


