Figure 1.

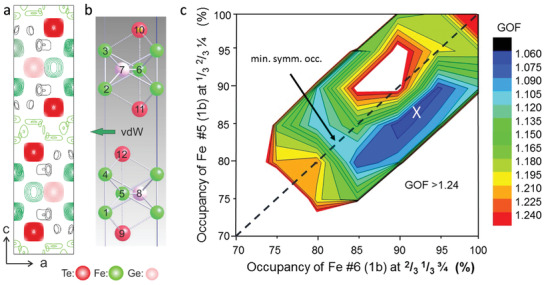
X‐ray diffraction analysis. Charge density ρ(x,y,z) contour plot a) and corresponding structure model b) in projection along the b‐axis. Red, green, and pink balls represent Te, Fe, and Ge atoms, respectively. Atoms are labeled in relation to Table S1 in the Supporting Information. Each intense charge density maximum in (a) has a direct counterpart in the refined positions of the atoms. In addition, ρ(x,y,z) also exhibits several faint contours, most prominent within the vdW gap. c): Contour map of GOF versus site occupancies of Fe atoms #5 and #6. The global minimum is indicated by the white cross. The dashed diagonal indicates the condition Θ(5) = Θ(6) in the case of a centrosymmetric space group for which a local minimum at Θ = 0.83 is found.[ 20 ] The white area corresponds to the condition GOF > 1.24.
