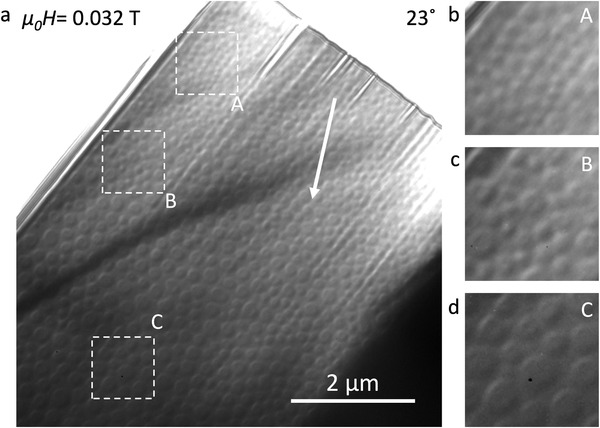
Figure 3.

Thickness dependence of skyrmion size in lamella L1. a) LTEM overview of a wedge‐shaped lamella recorded at 100 K after the field cooling procedure described in the main text. Arrow shows the direction of increasing thickness and white squares represent three regions 1 µm × 1 µm in area with different thicknesses labelled as A, B, and C. b–d) magnified images of the three regions shown in (a).
