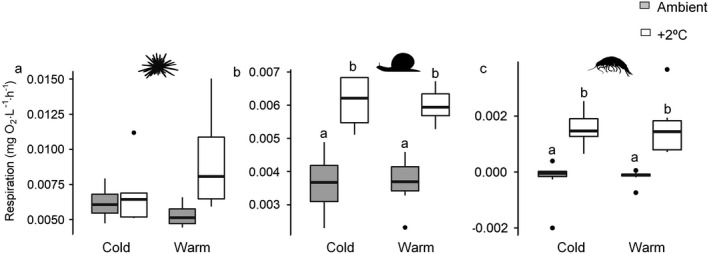
Fig. 2.

O2 consumption per individual per hour of three consumers: (a) Echinus esculentus, (b) Steromphala umbilicalis, and (c) Gammarus spp. fed different kelp assemblages (cold and warm affinity) under different warming treatments (ambient and + 2ºC). The upper and lower boundaries of each box represent the 75th and 25th percentiles, respectively, and the solid in the middle represents the median. Upper and lower whiskers represent the 90th and 10th percentiles, respectively. Lowercase letters represent groups of means that are statistically indistinguishable (P < 0.05) between kelp assemblages and individual kelp species based on post hoc tests.
