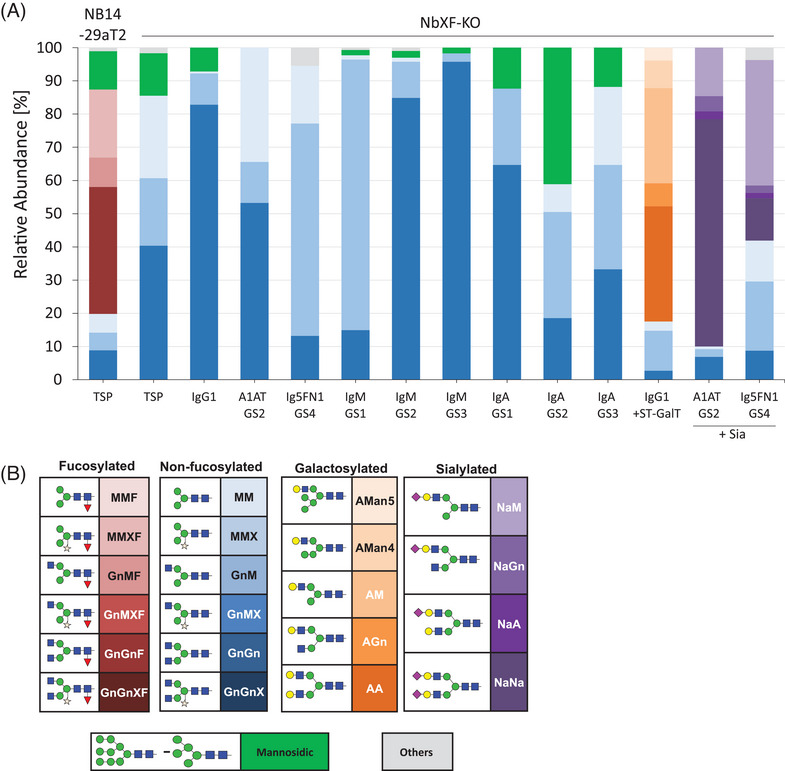
FIGURE 2.

N‐glycan composition of endogenous proteins and recombinantly expressed glycoproteins. (A) Relative quantification of N‐glycans of total soluble proteins (TSP) and recombinantly expressed reporter proteins. IgG1: Immunoglobulin G1 (rituximab); A1AT: human α1‐antitrypsin, Ig5FN1: module of human neural cell adhesion molecule (NCAM); IgM: Immunoglobulin M; IgA: Immunoglobulin A2m; GS: glycosite; ST‐GalT: co‐expression of IgG1 with modified human β1,4‐galactosyltransferase[ 24 ]; +Sia: co‐expression of glyco‐reporter with multi‐gene vector PICH88266 carrying six genes for introducing the human sialylation pathway into plants.[ 26 ] NB14‐29aT2 represents progenitor line. TSP represent average of 6 independent T4 NbXF‐KO plants, IgG1 represents 4 independent T4 plants. For further details see Figure S8 and Tables S8, S9 and S10. (B) Schematic representation of glycoforms according to Consortium for Functional Glycomics (www.functionalglycomics.org).
