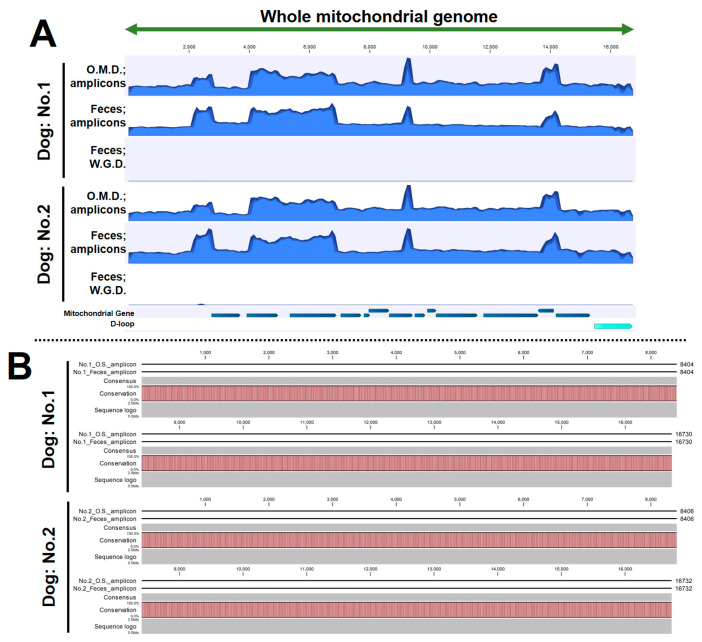
Figure 6.
Coverage waveform through visualization of BAM files and alignment of nucleotide sequences: (A) coverage waveforms using the BAM files from each sample, and (B) alignment analysis between amplicon sequencing of fecal DNA and oral mucosal DNA. This figure is useful for visually checking for mismatched bases. In the event of mismatches in the base sequences obtained from oral mucosal DNA and fecal DNA amplicon sequences, the pink is not displayed, and a white blank is displayed instead. Therefore, the absence of a blank can be taken to confirm that there is a complete match on the alignment analysis. O.M.D: oral mucosal DNA, W.G.D: whole-genome DNA.

