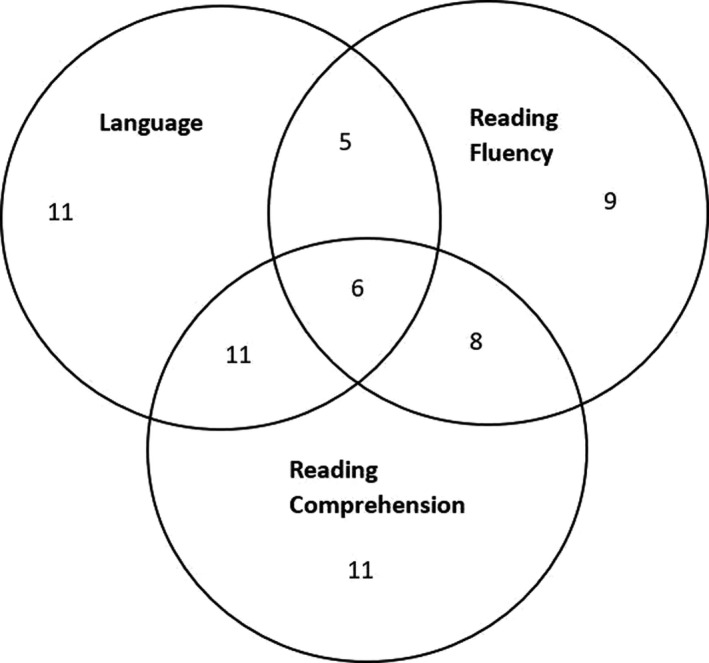
FIGURE 1.

Overlap between poor outcomes in oral language, reading fluency and reading comprehension (N), for the subset of children for whom we had data on all three outcomes (N = 163), and who met criteria for at least one poor outcome at 12 (N = 61). Note: a small number of additional children, who were included in the main analyses but not this figure, had a poor outcome in one domain, but were missing data for the other outcomes (language N = 1, reading fluency N = 6, reading comprehension N = 2)
