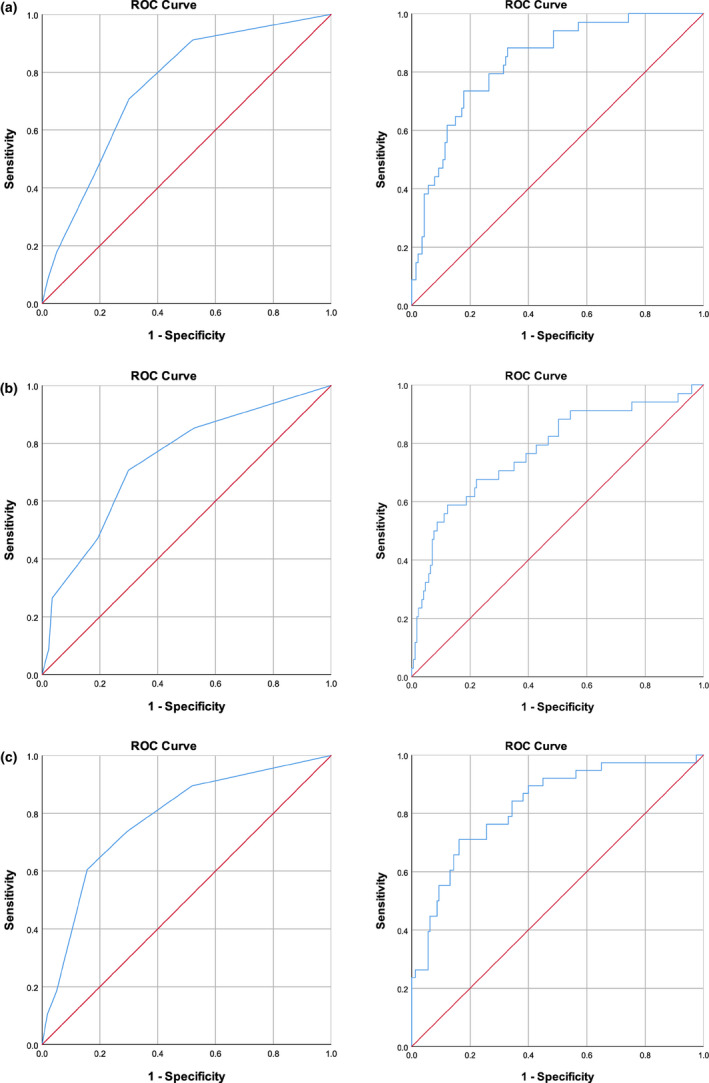
FIGURE 3.

Area Under the Curve for prediction from the Cumulative Risk Index (categorical predictors; left panels) and the probability estimated from the logistic regression analysis (continuous predictors; right panels). (a) Poor language outcome. (b) Poor reading fluency outcome. (c) Poor reading comprehension outcome
