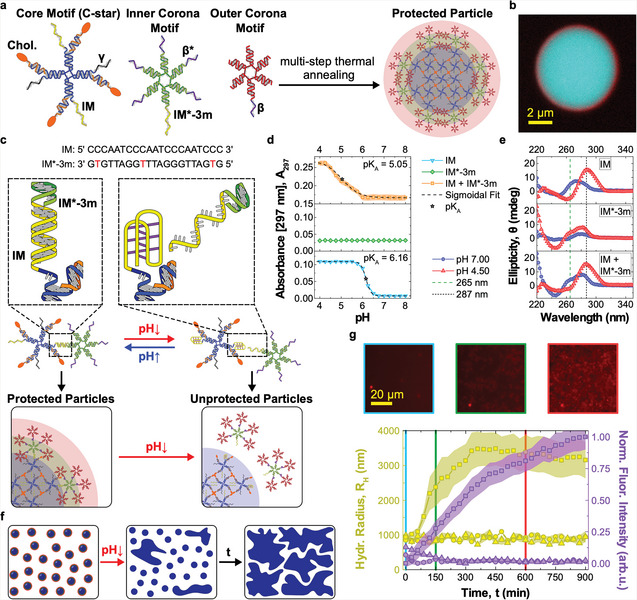
Figure 2.

Core–shell DNA‐based particles form a network in response to pH changes. a) Core–shell DNA particles assemble from cholesterolized (core motifs, CMs) and non‐cholesterolized DNA nanostars (inner and outer corona motifs, ICM, and OCM, respectively).[ 54 ] CMs, composed of cholesterol‐functionalized (orange) and non‐functionalized strands (blue), form the hydrophobic particle core. ICMs and OCMs create a stabilizing corona. CMs and ICMs bind through domains IM and IM*‐3m, while ICMs and OCMs attach through β−β* overhangs. Domain can be used to fluorescently label CMs, by connecting to an Alexa Fluor 594‐labeled duplex. When not used, γ is replaced by a poly‐T sequence. Sequences of all strands used in this work and composition of all samples are outlined in Tables S1 and S2 (Supporting Information), respectively. The relative thickness of core and shell region in the schematics is not in scale. b) Confocal microscopy image of a large particle with distinguishable core–shell structure, assembled through a slow annealing protocol. Particles used in the remaining experiments had a much smaller size (200 nm to 1 µm, see Experimental Section). CMs are shown in cyan (fluorescein), OCMs in red (Alexa Fluor 647). c) IM and IM*‐3m domains are designed to cause the detachment of ICMs from CMs at low pH. IM is C‐rich, able to form a non‐canonical i‐motif under acidic conditions,[ 59 ] resulting in destabilization of the duplex formed by IM and IM*‐3m. The duplex is rendered less stable by mismatches between the two sequences (red). d) pH‐dependence of the UV absorbance at 297 nm, measured as proxy for i‐motif formation,[ 60 , 61 ] for samples of IM, IM*‐3m, and IM + IM*‐3m oligonucleotides (not linked to star motifs). Increase in marks i‐motif formation achieved at pH ≈6.16 for isolated IM and ≈5.05 when also IM*‐3m is present, with the difference ascribed to competition between duplex and i‐motif formation. The transitional pH (p K A) values were calculated as the inflection points of sigmoidal fits. No response was observed in isolated IM*‐3m. The data are shown as mean ± standard error (shaded regions) of two experiments performed on two independently prepared samples, each consisting of three measurements. e) Circular dichroism (CD) spectra of the samples in (d) Characteristic maxima at 287 nm and minima at 265 nm[ 60 , 61 ] confirm i‐motif formation in IM and IM + IM*‐3m samples. Data are averaged over three measurements. f) Schematic representation of pH‐induced particle aggregation. pH decrease leads to i‐motif formation, corona displacement, exposure of the sticky cholesterol–DNA cores, and ultimately particle aggregation. g) Bottom: particle aggregation after pH decrease tracked by measuring the hydrodynamic radius of growing aggregates with differential dynamic microscopy (DDM, left axis)[ 62 , 63 ] and the normalized epifluorescence intensity of accumulating CMs labeled with Alexa Fluor 594 (red, right axis). Triangles and squares represent responsive particles incubated at pH 7.0 (triangles) and 4.5 (squares). Circles indicate a control sample with nonresponsive particles at pH 4.5, where the IM and IM*‐3m domains have been replaced with non‐responsive sequences. Data are plotted as mean ± standard error (shaded regions) of three (circles and triangles) or six (squares) measurements conducted on two independently prepared samples. Top: epifluorescence microscopy images of responsive particles after pH decrease at different time points (t = 0, 150, and 600 min). See Figure S5, Supporting Information for additional microscopy images.
