Figure 3.

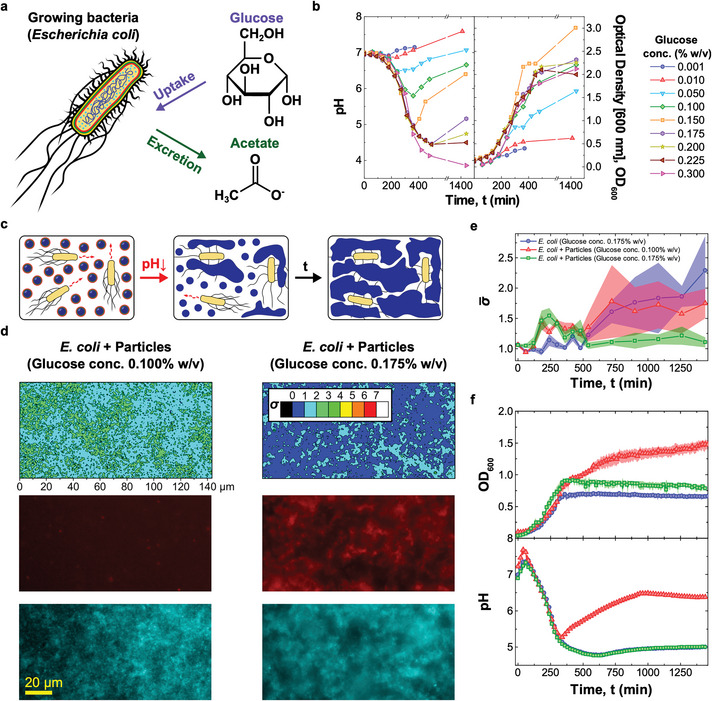
pH‐responsive DNA particles trap E. coli when triggered by bacterial metabolism a) Glucose metabolism in E. coli leads to acetate release and pH decrease.[ 55 ] b) (left) Bacteria‐induced pH changes depend on glucose concentration in the medium, . For intermediate values (0.050% w/v 0.200% w/v) the pH decreases and reaches a minimum before recovering. For 0.225% w/v recovery is not observed. Glucose concentration influences bacterial growth, quantified through turbidity (OD) measurements at 600 nm (right). Culture yield increases with , is maximized at intermediate values, and decreases at higher glucose concentration, possibly due to excessive medium acidification. Data for ρ G = 0.175, 0.200, and 0.225% w/v are shown as average of three independent repeats, the remaining points are from a single repeat. c) Diagram illustrating E. coli trapping by the synthetic DNA net. Bacterial metabolism reduces the pH, causing particle activation and the formation of a sticky network (Figure 2) that embeds the cells. d) (top) E. coli immobilization induced by DNA net formation as quantified through the motility parameter , extracted from bright‐field microscopy videos (see Experimental Section). The two colormaps are relative to samples containing E. coli, responsive particles and different ρ G values, one insufficient (0.100% w/v, left) and the second sufficient (0.175% w/v, right) to reach the pH threshold for particle activation (5.05, see Figure 2d). Bottom: epifluorescence microscopy images corresponding to the ‐maps. Core motifs are labeled with Alexa Fluor 594 (red), while E. coli express EGFP (cyan). Smaller σ‐values and co‐localization of DNA and bacteria observed in the sample with higher glucose concentration confirm the ability of cholesterol–DNA networks to bind and immobilize E. coli. ‐maps and images were collected at = 1440 min after sample preparation. e) Time evolution of the frame averaged motility parameter recorded for the samples in (d) and a control sample with E. coli and = 0.175% w/v, but lacking DNA particles. The decrease in noted in the sample with responsive particles and higher glucose concentration confirms reduced E. coli motility following trapping. Data are shown as mean ± standard error of seven measurements conducted on three independent repeats. Associated ‐maps and epifluorescence microscopy images are shown in Figure S11, Supporting Information. f) Time‐traces of OD (top) and medium pH (bottom) for the three samples in (e). The pH was measured using the ratiometric pH probe FITC‐dextran, added in solution (see Figures S9 and S10, Supporting Information, and Experimental Section). For both OD and pH, data are shown as averages of three independent repeats. For the OD curves, standard errors are shown as shaded regions.
