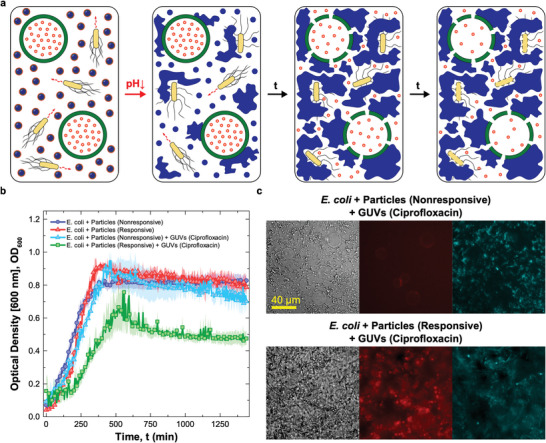
Figure 4.

Synthetic cell signaling network produces netosis‐like response a) Diagram illustrating the mechanism of action of the synthetic signaling network producing a netosis‐like response. Medium acidification caused by E. coli glucose metabolism activates the DNA‐particles. The particles form a sticky DNA–cholesterol network that, simultaneously, traps the bacteria and permeabilizes giant unilamellar vesicles (GUVs) loaded with antibiotic ciprofloxacin. The released antibiotic hinders bacterial growth. b) Antimicrobial response as determined via turbidity measurements (OD at 600 nm). Data are shown for four samples as the mean of three independent repeats ± standard errors (shaded regions). One sample includes E. coli, antibiotic‐loaded GUVs, responsive particles, and sufficient glucose to achieve their activation ( = 0.175% w/v), and is thus capable of supporting the cascade of reactions producing the sought netosis‐like response (green squares). The other tree samples are controls missing one or more key components. Two control samples lack antibiotic‐loaded GUVs, and feature either non‐responsive (blue circles) or responsive (red triangles) DNA particles. The third control sample contains antibiotic‐loaded GUVs but uses non‐responsive particles. While all control samples show similar OD curves, growth is delayed and suppressed in the system capable of sustaining the designed cascade of reactions. c) Bright‐field and epifluorescence microscopy images of samples containing E. coli, nonresponsive (top) or responsive (bottom) particles and ciprofloxacin‐loaded GUVs, recorded at = 1440 min after sample preparation. Aggregation of DNA and the lack of GUVs in the sample with responsive particles indicates the successful rupture of vesicles following DNA‐net formation. The released antibiotic hinders E. coli division, causing cell elongation. Particles (core motifs) are shown in red (Alexa Fluor 594), E. coli in cyan (EGFP). See Figure S16, Supporting Information for additional bright‐field and epifluorescence microscopy images recorded at = 0 and 1440 min.
