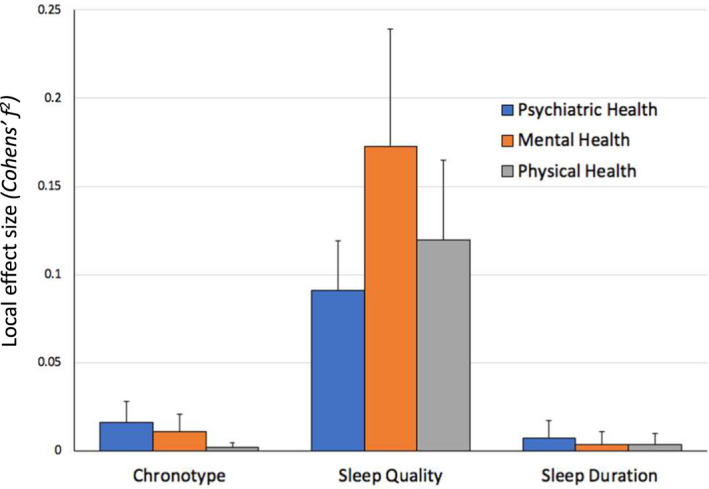
Figure 2.

The Effect of Chronotype, Sleep Quality and Sleep Duration on Health Measures. A visual summary of the average local effect sizes of the chronotype, sleep quality, and sleep duration measures on general psychiatric, mental and physical health outcomes. Each column represents the average effect size of all chronotype, sleep quality and sleep duration measures from 27 different regression model combinations with the error bar representing one standard deviation. According to Cohen's (1988) guidelines f2 ≥ 0.02, f2 ≥ 0.15, and f2 ≥ 0.35 represent small, medium, and large effect sizes, respectively
