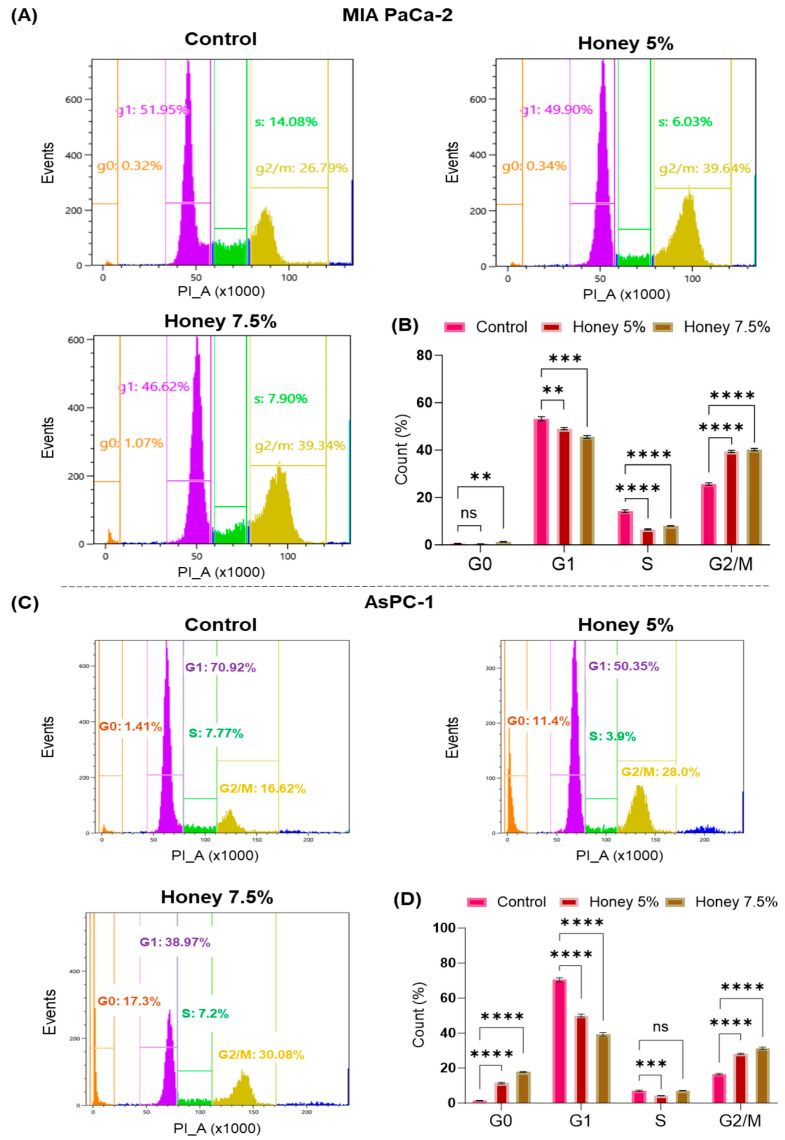
Figure 7.
Honey induces cell cycle arrest in PanCa cells. (A). Effect of honey on cell cycle distribution in MIA PaCa-2 cells as determined by flow cytometric analysis after 24 h of honey exposure. (B). The bar graph represents the % distribution of the MIA PaCa-2 cells in the G0, G1, S, and G2M phases. The level of significance: ns p = 0.5470; ** p < 0.0037; *** p < 0.0002; **** p < 0.0001. (C). Honey arrests the cell cycle in the G0 and G2/M phases of AsPC-1 cells after 24 h of honey exposure. (D). The bar graph represents the % distribution of the AsPC-1 population in the G0, G1, S, and G2M phases. The level of significance: ns p = 0.9260; *** p < 0.0009; **** p < 0.0001.

