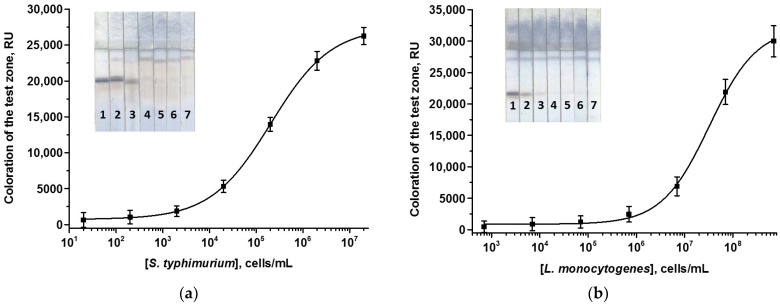
Figure 4.
Calibration curves of S. typhimurium (a) and L. monocytogenes (b) in the enhanced ICAs using PBNPs and the appearance of test strips. Concentrations of Salmonella/Listeria cells were 2 × 10⁷/7 × 108 (1), 2 × 10⁶/7 × 107 (2), 2 × 10⁵/7 × 106 (3), 2 × 10⁴/7 × 105 (4), 2 × 10³/7 × 104 (5), 2 × 10²/7 × 103 (6), and 20/700 (7) cells/mL (n = 3).

