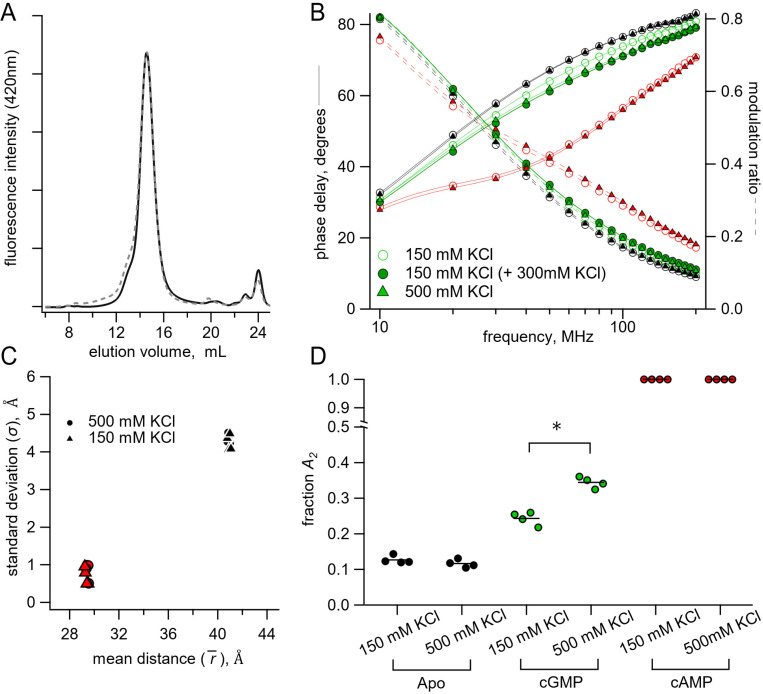
Fig. 7.
Lifetime measurements in 150 mM KCl versus 500 mM KCl conditions. (A) Normalized SEC traces of SthKC-term in 150 mM KCl (solid curve) and 500 mM KCl (dashed curve). (B) Representative Weber plot for [Fe(phenM)3]2+ lifetimes in 150 mM (open circles) and 500 mM KCl (closed triangles), in each ligand condition (apo, black; cGMP, green; cAMP; red). An additional lifetime trace is shown for an experiment where additional 300 mM KCl was added to the protein sample with 150 mM KCl in cGMP (closed green circles). (C) Comparison of Gaussian average distance, , and standard deviation, , between ionic concentrations using model global fitting of [Fe(phenM)3]2+ and [Ru(bpy)2phenM]2+ with the sum of two Gaussians (apo, black, and cAMP, red, n=4). (D) Fraction of active state in each condition () for 150 mM KCl and 500 mM KCl using the sum of two Gaussian model fits [apo P=0.2, cGMP *P=0.0001].

