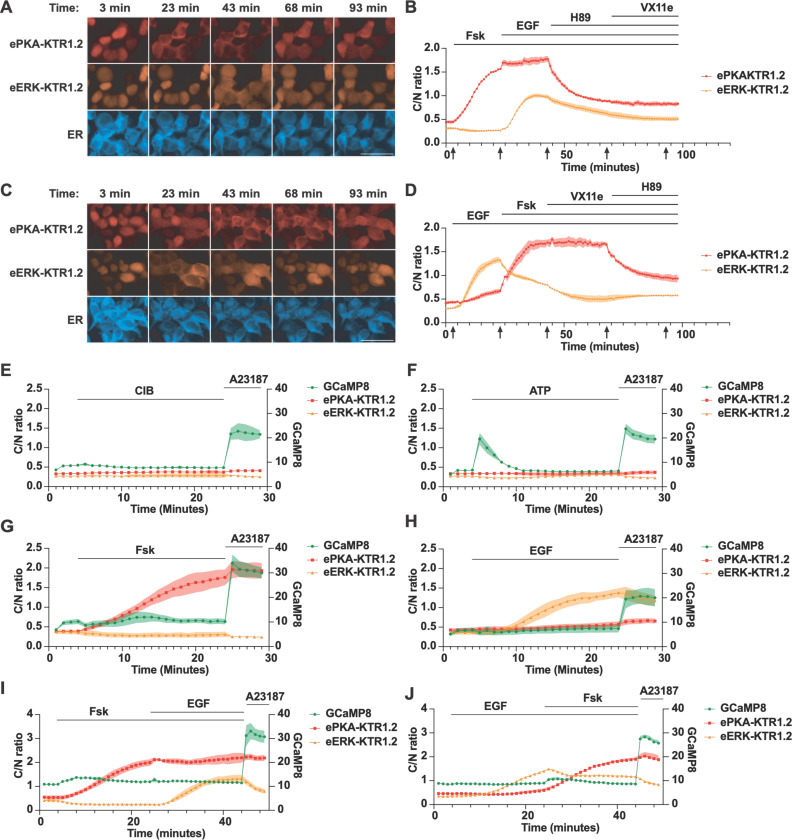
Figure 4. Simultaneous measurement of PKA activity, ERK activity, and calcium.
(A) Representative fluorescence images of HEK293 cells co-expressing ePKA-KTR1.2/tdTomato, eERK-KTR1.2/emiRFP670, and ER-mTagBFP2 exposed to Fsk at t = 3 min, then EGF at t = 23 min, then H89 at t = 50 min, then VX11e at t = 75 min, with images collected at t = 3, 23, 43, 68, and 93 min. Bar, 50 µm. (B) Plot of C/N ratios of (red) ePKA-KTR1.2/tdTomato and (orange) eERK-KTR1.2/emiRFP670 every 60 seconds, showing their responses to Fsk, then EGF, then H89, then VX11e. Lines at the top denote the times of chemical addition, and arrows at the bottom denote the times at which the images of A were collected. (C) Representative fluorescence images of HEK293 cells co-expressing ePKA-KTR1.2/tdTomato, eERK-KTR1.2/emiRFP670, and ER-mTagBFP2 exposed to Fsk at t = 3 min, then EGF at t = 23 min, then H89 at t = 50 min, then VX11e at t = 75 min. Bar, 50 µm. (D) Plot of C/N ratios of (red) ePKA-KTR1.2/tdTomato and (orange) eERK-KTR1.2/emiRFP670 every 60 seconds, showing their responses to EGF, then Fsk, then VX11e, then H89. (E-J) Plots of (green) GCaMP8 fluorescence intensity, (red) ePKA-KTR1.2/tdTomato C/N ratio, and (dark red) eERK-KTR1.2/emiRFP670 C/N ratio calculated from images collected at every minute as the cells were exposed to (E) CIB then A23187, (F) ATP then A23187, (G) Fsk then A23187, (H) EGF then A23187, (I) Fsk then EGF then A23187, or (J) EGF then Fsk then A23187. Lines at the top denote the times of chemical addition, C/N ratios are reflected in the left Y-axis, and GCaMP fluorescence intensity is reflected in the right Y-axis. Data are from a minimum of three independent biological replicates.

