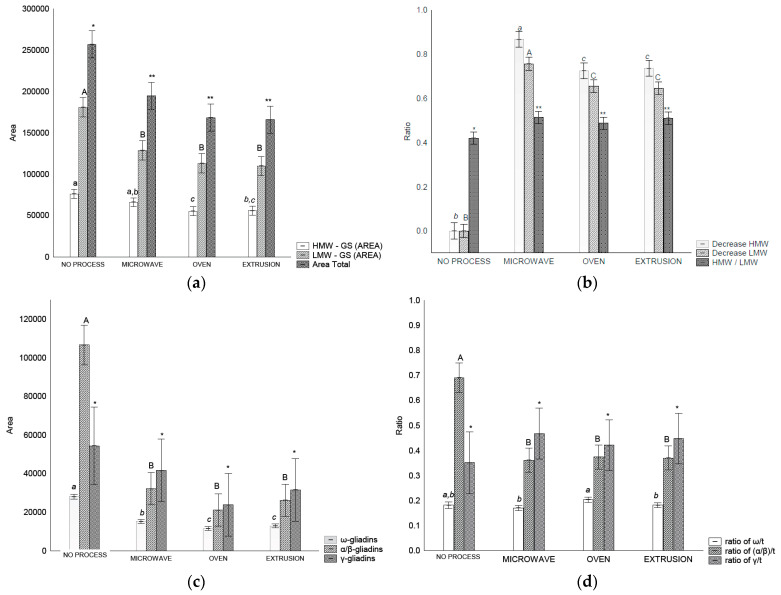
Figure 3.
RP-HPLC separation of glutenins and gliadin in control flour before and after treatments: (a) area of total glutenins, HMW-GS and LMW-GS, (b) ratios between HMW-GS control flour/HMW-GS treatment, LMW-GS flour/LMW-GS treatment, and HMW/LMW-GS, (c) area of each gliadin fraction, (d) relation of gliadins fraction and total gliadin. Legend: Different letters (uppercase/lowercase) or symbols indicate different means according to Tukey’s test (p < 0.05). Vertical bars indicate the standard deviation. No process = control flour.

