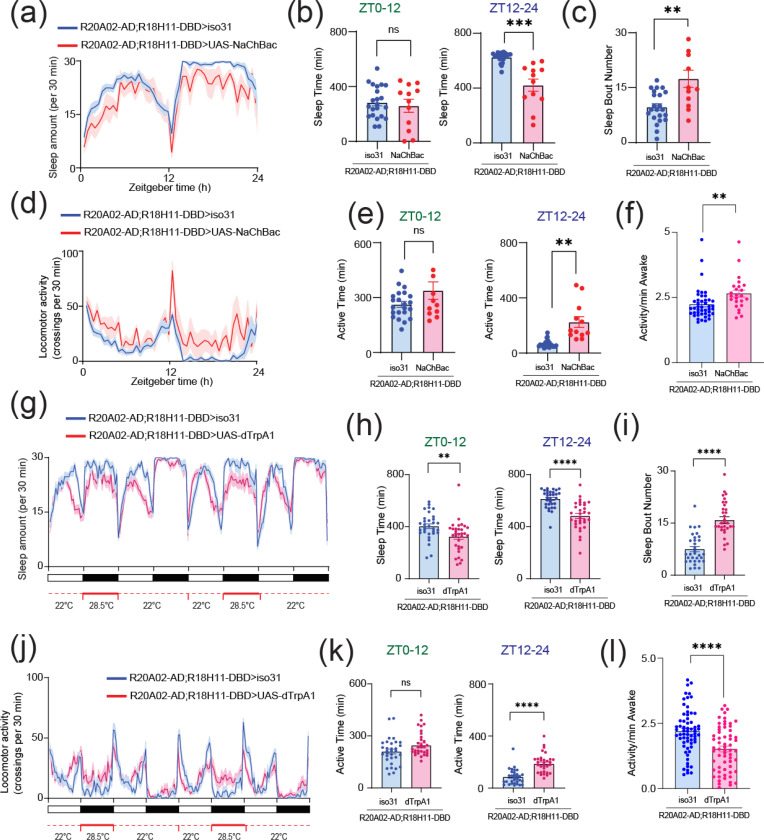
FIGURE 7.
(a) Sleep profiles (b) Sleep time at ZT0–12 and ZT12–24 (c) Sleep bout number of R20A02-AD;R18H11-DBD>iso31 (blue, N=23) and R20A02-AD;R18H11-DBD>UAS-NaChBac (red, N=12) flies. Sleep time plotted in 30 min bins. (d) Activity profiles (e) Active time at ZT0–12 and ZT12–24 (f) Daily waking activity of R20A02-AD;R18H11-DBD>iso31 (blue) and R20A02-AD;R18H11-DBD>UAS-NaChBac (red) flies. (g) Sleep profiles (h) Sleep time at ZT0–12 and ZT12–24 (i) Sleep bout number of R20A02-AD;R18H11-DBD>iso31 (blue) and R20A02-AD;R18H11-DBD>UAS- dTRPA1 (red) flies. (j) Activity profiles (k) Active time at ZT0–12 and ZT12–24 (l) Daily waking activity of R20A02-AD;R18H11-DBD>iso31 (blue) and R20A02-AD;R18H11-DBD>UAS- dTRPA1 (red) flies. The statistics used were unpaired t-test with *p < 0.05 and **p < 0.01 and ns indicated non-significant.

